Analysis of US Divorce & Child Custody Policies 1997

An Analysis of US Child Custody Policies and Divorce Rates (16 years ago)

The link between 1/. joint custody and 2/. the rates of divorce

Richard Kuhn and John Guidubaldi, in a presentation to the 1997 Annual Conference of the Children’s Rights Council, showed a significant correlation between ‘joint physical custody awards’ and reduced divorce. Their conjecture, 16 years ago, was that a parent who ‘expected’ to receive sole custody was more likely to file for divorce than one who may be awarded shared custody.

Sole custody allows one parent to hurt the other by taking away the children, and usually involves higher child support transfers than shared physical custody. Are these the main reasons why there has been persistent opposition to share parenting, ie fuelled by the desire to hurt (and keep hurting) the other parent and egotistical desire for wages without working

So looking back over those 16 years,  how true have their conjectures proven to be regarding divorce and its link to the type of custody ordered ?

‘Child Custody Policies and Divorce Rates in the U.S’

Authors:

Richard Kuhn is a research evaluator for the Children’s Rights Council, and John Guidubaldi is professor of psychology at John Carroll University and Kent State University, Ohio. He served as commissioner on the U.S. Commission on Child and Family Welfare, is past president of the National Association of School Psychologists, and is a research evaluator for the Children’s Rights Council

Abstract

This paper compares divorce rate trends in the United States in states that encourage joint physical custody (shared parenting) with those in states that favor sole custody.

  1. States with high levels of joint physical custody awards (over 30%) in 1989 and 1990 have shown significantly greater declines in divorce rates in following years through 1995, compared with other states.
  2. Divorce rates declined nearly four times faster in high joint custody states, compared with states where joint physical custody is rare. As a result, the states with high levels of joint custody now have significantly lower divorce rates on average than other states.
  3. States that favored sole custody also had more divorces involving children.

These findings indicate that public policies promoting sole custody may be contributing to the high divorce rate. Both social and economic factors are considered to explain these results. [NB. In Britain before the 1989 Children Act, joint physical custody orders were common ion the Midlands and Southern court circuits. The proportion of such awards ranged from 30% to over 40% of all custody awards. In the North they were frequently no more than 5% – RW ].

Introduction

Empirical evidence shows that children raised by a divorced single parent are significantly more likely than average to have problems in school, run away from home, develop drug dependency, or experience other serious problems (e.g., Amato and Keith, 1991; Guidubaldi, Cleminshaw, Perry, and McLoughlin, 1983; Hetherington and Cox, 1982).

Although many single parent families are created as a result of unwed motherhood, far more are the result of divorce. Of 18.6 million children in the United States living with only one parent, approximately two-thirds are with divorced or separated parents (Census, 1994). This paper investigates the relationship between child custody policies and changes in the U.S. divorce rate, using data from a 19 state sample collected by the National Center for Health Statistics of the Centers for Disease Control.

Custody Policies

In the US, States differ widely in their policies toward joint custody. Many states routinely grant joint legal custody, which gives the non-residential parent the right to participate in major decisions about the children’s upbringing and to view certain records. Joint legal custody does not affect the child’s living arrangements. Often it is granted with the traditional residence arrangement, in which the child lives with one parent but visits the other parent four days per month.

Less commonly, joint physical custody is awarded. With joint physical custody (also called shared parenting), the child lives with both parents, often on an ‘alternating week’ basis.

Joint physical custody is usually defined as a schedule where the child has at least a 30/70 time share between parents, although 50/50 arrangements are a common form of shared parenting (Ricci, 1981).

Some form of joint custody is a preference or presumption in a few states, while in some other states with no preferred custody option, judges have favorable attitudes toward joint custody and frequently grant it. For the 19 states in the NCHS sample, the average rate of joint physical custody awards in 1990 was 15.7%, and in two states joint physical custody was awarded in nearly half of the cases.

State policies on joint custody have changed significantly in the past 25 years. Because of maternal preference policies, joint custody was unusual before 1970, although divorced families in times past sometimes worked out arrangements that were equivalent to modern joint custody (Ricci, 1981). [This would roughly coincide with custody practices in Britain prior to the 1989 Act and underscores the influence of Anna Freud’s “Best Interest of the Child” series of books – RW ].

For example, the Maryland Court of Appeals considered a case in 1934 in which the division of time between parents was equivalent to joint physical custody (McCann v. McCann), although the term joint custody had not yet been invented. As maternal preference laws were found to violate the 14th Amendment guarantee of equal protection under the law in the 1960s and 1970s (Roth, 1976), joint custody began to increase. Although much has been written about links between “no-fault'” divorce laws and the divorce rate, there has been little discussion of the effect of child custody policies on the divorce rate.

Custody Policies and the Divorce Rate

It might be argued that joint custody could encourage divorce, by making divorce “easier.”[ i.e. less arguments, less assets in jeopardy of loss and less complications, one presumes – RW]

On the other hand, widespread acceptance of joint physical custody might be expected to reduce the divorce rate, because joint custody makes it difficult for an angry parent to hurt the other by taking away the children, or to relocate and thereby eliminate interaction with the other parent. In addition, an economic argument has been advanced that high levels of child support associated with sole custody may encourage divorce, because custody of children represents an asset for the custodial parent to the extent that child support payments exceed the cost of raising a child (Muhtaseb, 1995).

Because joint physical custody results in a more equal division of parenting time, child support payments may be lower, although there are still payments unless both parents have the same income.

States that more frequently award joint physical custody may thus see a decline in the divorce rate. To date, no study has provided empirical evidence to support either hypothesis about the effect of joint custody policies on the divorce rate.

Data

State divorce rates and other vital statistics are maintained by the National Center for Health Statistics (NCHS), a division of the Centers for Disease Control, U.S. Department of Health and Human Services. The divorce rate measure used is the number of divorces per thousand population. A 1995 NCHS report (Clarke, 1995) gives data on physical custody awards for 19 participating states for the years 1989 and 1990. This NCHS report is the first of its kind to report figures for physical custody of children. Values given are percentages of sole custody father, sole custody mother, and joint custody awards.

Figures for 1989 and 1990 are given, separated by a “/”. In some cases the total may be slightly less than 100% because awards to persons other than mother or father (generally from 0 to 2% in the NCHS report) are not included in Table 1. More recent data are not yet available. Table 1 shows the physical custody awards for these states. The definition of joint physical custody used in the NCHS study is a minimum of 30% time share with each parent (Clarke, 1996).

Figures for 1989 and 1990 are similar, although the percentages for joint custody are slightly higher in 1990 for those states reporting both years. For five states, 1989 figures were not available; these are indicated as “NA”. States were divided into categories of ‘High’ (above 30%), ‘Medium’ (10% to 30%), or ‘Low’ (below 10%) levels of joint physical custody awards, as shown in Table 1 (below).

Kuhn_T1

Findings and Discussion

Divorce rates for 1989, 1990 and 1991 were compared with 1993, 1994 and 1995 levels, as shown in Table 2. Comparisons between basal values of 1989/1990/1991 and values for 1993/1994/1995 are used rather than absolute values in order to factor out differences that may be unrelated to custody policies. For example, states differ in their ethnic, religious, and racial compositions, factors that can affect the divorce rate. The effect of custody policies can be more precisely isolated by using differences across time, just as the effect of a medication is isolated by comparing before and after treatment values for subjects whose initial (and final) values for blood pressure, heart rate, or other measures may be significantly different.

Initial values and values four years later for the state groups are shown in Table 3. Table 3 also shows 1980 divorce rate averages for the three groups. Joint custody had begun to emerge as a custody option in 1980, although its adoption into state policies occurred at different points. Rate changes between 1980 and 1990, therefore, are likely to contain some effects of policies regarding joint custody. Note that the High and Medium joint custody groups had very similar divorce rate declines between 1980 and 1994 (by approximately 1.1 and 1.2 per thousand respectively), while the states with Low levels of joint custody had a decline of only 0.4 per thousand between 1980 and 1994.

Kuhn_T2As can be seen from Table 2 and Table 3, the states with high levels of joint custody had significantly lower divorce rates four years later. States with higher levels of joint custody had an average four-year decline in the divorce rate approximately double that for states with medium levels of joint custody. Kuhn_T3On a percentage basis, between 1989 and 1994 the rate in the High joint custody group declined by 8%, in the Medium group by 4%, and in the Low group by less than 1%.

Annotation Take Montana as an example:  it is rated – in Table 1 – as having a ‘high’ rate of joint custody awards (43% – 44%),  but between 1989 and 1995 it had a lowering divorce rate, down from  5.1. to 4.8 (Table 2). Similarly, Kansas had a fall between 1991 to 1995 of ‘minus 1.3’ and an increased  joint physical  custody rate of 39%  – 43 %.

Figure 1 [below] shows joint custody awards and divorce rate changes for the 19-state NCHS sample. States are ordered [ i.e. arranged] by level of joint custody awards in 1990. As joint custody awards increase, states in general have greater declines in divorce rates.

Kuhn_Fig1Figure 2 summarizes the changes in divorce rates for states in the three joint custody categories.

Statistical analysis shows that the correlation between joint physical custody and reduced divorce is almost certainly not due to chance fluctuation. The statistical measure used is a correlation of the average of joint custody awards per state in 1989 and 1990 with the average decline in divorce rate from 1989 Kuhn_Fig2through 1991 to 1993 through 1995 (i.e., difference between the average of 1993, 1994, and 1995 rates and the average of 1989, 1990, and 1991 rates.)

Annotation – Visually the graph above is drawing our attention to three distinct trend lines and what they imply. The trend line of divorcing numbers that falls the least is where joint custody is under 10%. Both divorcing numbers trend lines, for 10% – 30% joint custody and for 3%  – 50% joint custody fall faster than the 10% line but the greatest uninterrupted fall is among the   30% -50%  joint custody category.

This is the average of the “Joint” column of Table 1 correlated with the difference between the average of 1993 to 1995 rates and 1989 to 1991 rates in the “Divorce Rates by Year” column of Table 2.

There is less than a 5% probability that this correlation is due to chance (correlation coefficient r = .47, p < .05). (Note: Wisconsin reported numbers in 1989 but not in 1990, so it was not included in this analysis. However, separate calculations show that inclusion of the Wisconsin data does not affect the statistical significance of the results.)

One possible explanation to consider for the difference in divorce rates between high and low joint custody states is an effect resulting from changes in marriage rates. If marriage rates per thousand population increase, then divorce rates per thousand population in following years can increase if marriages fail at the same rate. Similarly, divorce rates can decrease during a particular period if marriage rates decreased in previous years, because fewer marriages were created. Thus it is important to look at whether the greater decline in divorce rates in high joint custody states during the early 1990s results from a decrease in marriage rates during the early 1980s. Table 4 shows the change in marriage rates between 1980 and 1985, a decade before the period under study.

Kuhn_T4If the greater decline in divorce rates for High joint custody states results from declining marriage rates in previous years, then we would expect marriage rates for these states to show larger decreases in the early 1980s than the Low joint custody states. As can be seen from Table 4, the reverse is true.

The low joint custody states actually had greater declines in marriage rates during the early 1980s. If marriages continued to fail at the same rate during the decade, then these states should also show greater declines in divorce rates during the early 1990s. The fact that they did not suggests that other factors may be at work. It is not reasonable to conclude that the decrease in divorce rates associated with joint custody is simply a result of declines in marriage rates. A second explanation proposed here considers both social and economic factors.

Before the 1960s, social pressures and legal requirements made divorce relatively uncommon in the U.S. Divorce typically required grounds severe enough that a reasonable person could not expect the marriage to continue: adultery, desertion, abuse, insanity or imprisonment of a spouse. With a few exceptions, states adopted unilateral “no-fault” divorce laws in the 1960s and 1970s, which allowed a spouse to abandon a marriage without traditional grounds [ or consequences ! – RW].

Divorce was actually encouraged by some as an antidote to boredom, or for other reasons that might have been considered frivolous a generation before. About 80% of U.S. divorces today result from the unilateral decision of one spouse, rather than the joint decision of both (Gallagher, 1996), with the spouse who files for divorce first often having an advantage.

If one investigates the simple question, “who initiates divorce,” we find from the Monthly Vital Statistics Report May 21, 1991 (NCHS, 1991), that from 1975 to 1988, in families with children present, wives file for divorce in approximately 2/3 of the cases each year. In 1975, 71.4% of the cases were filed by women, and in 1988, 65% were filed by women.

While these statistics alone do not compel a conclusion that women anticipate advantages to being single, rather than remaining in the marriage, they do raise that reasonable hypothesis. If women can anticipate a clear gender bias in the courts regarding custody, they can expect to be the primary residential parent for the children. If they can anticipate enforcement of financial child support by the courts, they can expect a high probability of support monies without the need to account for their expenditures.

Clearly they can also anticipate maintaining the marital residence, receiving half of all marital property, and gaining total freedom to establish new social relationships.

Weighing these gains against the alternative of remaining in an unhappy marriage may result in a seductive enticement to obtain a divorce, rather than to resolve problems and remain married. States that favor sole custody in divorce may thus expect to see more divorce than states that encourage joint custody.

On a practical level, joint physical custody makes it less likely that a parent can move to another city to eliminate interaction with the other parent. Because both parents provide for the child directly, child support payments may be somewhat lower with joint custody, reducing financial motives for divorce. Perhaps most significant, joint custody also removes the capacity for one spouse to hurt the other by denying participation in raising the children. The correlation between joint custody and reduced divorce may have a simple explanation. If a parent considering a divorce is told by an attorney that a judge will probably not permit him or her to relocate with the children, and that the other parent will continue to be involved, he or she may decide that it is easier to work out problems and remain married.

Kuhn_T5Put simply, when divorce becomes a less attractive alternative to marriage, we should expect less divorce. As can be seen from the findings, this appears to be happening in states with higher levels of joint custody. If sole custody reduces incentives to continue marriage, then we should also expect states that favor sole custody to have more divorces involving children. As can be seen from Table 5, the low joint/high sole custody states also had more divorces involving children, although the difference is not statistically significant.

Summary and Conclusions

The evidence reported in this paper indicates that widespread acceptance of joint physical custody will not increase the divorce rate, and may in fact reduce divorce. States whose family law policies – either by statute or through judicial practice – encourage joint custody have shown a much greater decline in their divorce rates than those that favor sole custody.

Both social and economic factors may explain the differences between divorce rates. Sole custody allows one spouse to relocate easily and to hurt the other by taking away the children. Potentially higher child support payments with sole custody may provide an economic motive for divorce as well. With joint physical custody, both social and economic motives for divorce are reduced, so parents considering divorce may simply decide it is easier to remain married. States whose policies result in more joint custody and less sole custody should thus see a reduction in divorce rates. The findings reported in this paper indicate that this is in fact happening.

End

Acknowledgements – We are very grateful to Sally C. Clarke for discussions on the NCHS data.

References

  1. Amato, P.R., and Keith, B. Parental divorce and the well-being of children: A metaanalysis. Psychological Bulletin (1991) 100:26-46.
  2. Census Bureau, U.S. Dept of Commerce, Current Population Reports, Series P20-484, Marital Status and Living Arrangements: March 1994, and earlier reports.
  3. Clarke, S.C., Advance Report of Final Divorce Statistics, 1989 and 1990. Monthly Vital Statistics Report, Vol. 43, No. 9, 1995. Centers for Disease Control and Prevention/National Center for Health Statistics.
  4. Clarke, S.C., personal communication, 1996.
  5. Gallagher, Maggie. The Abolition of Marriage, Regnery Press, 1996.
  6. Guidubaldi, J., Cleminshaw, H.K.,Perry, J.D., and McLoughlin, C.S. The impact of parental divorce on children: Report of the nationwide NASP study. School Psychology Review (1983) 12:300-23.
  7. Hetherington, E.M., Cox, M., and Cox, R. Effects of divorce on parents and children. In Non-traditional families. M.E. Lamb, ed. Hillsdale, NJ: Lawrence Erlbaum Associates, 1982,
  8. McLanahan, S. and Sandefur, G., Growing Up with a Single Parent, Harvard University Press, 1994.
  9. Majed R. Muhtaseb, An option pricing theory explanation of the increase in the divorce rate, Applied Economics Letters, Vol. 2 No.6, (1995).
  10. NCHS, Monthly Vital Statistics Report, Vol. 39, (May 21, 1991), National Center for Health Statistics.
  11. NCHS, Monthly Vital Statistics Report, Vol. 43, No. 13 (October 23, 1995), National Center for Health Statistics.
  12. NCHS, Monthly Vital Statistics Report, Vol. 43, No. 13 (October 23, 1995), National Center for Health Statistics.
  13. Ricci, I., Mom’s House, Dad’s House. Macmillan, 1981.
  14. Roth, A. The tender years presumption in child custody disputes. Journal of Family Law, Vol. 15, 1976.
  15. Statistical Abstract of the United States, 1993.

Same-sex marriages – Canada’s hidden data

by Robert Whiston  FRSA   Aug 13th 2013

 Arrow“Forever upwards” that’s the perception the Gay Lobby would like the pubic to believe. But do the actual numbers stack up that way – far away from the polemics on the ground.

The most populous cities, as measured by number of same sex couples, puts New York City at the head of the list with 47,000 followed by 12,000 in Los Angeles and Chicago with 10,000. [1] That was what the US Census of 2000 stated (and by now it might be far more).

But what is the situation today across the border in Canada ? There, same-sex marriages have been legal for a decade.

StatsCan – Canada’s statical service – boasted for many years that its ‘products’ were not only some of the best available but their reputation was so high that other country’s governments sent their statisticians to be trained by StatsCan.

So having compared homosexual unions and marriages in various EU countries in a previous article (https://motoristmatters.wordpress.com/2013/06/10/41/), and noted the rapid fall off in popularity following the legal reforms it was natural to turn to Canada to validate the phenomenon.

Canada has proudly broadcast to the world for many years its ‘liberal credentials’ in being more progressive than most and among the first countries to legalise same-sex marriage.

But what a shock lay in store. In reality Canada as a country does not collect same-sex marriage statistical – no, not even heterosexual ones ! !

1. The Shock

StatsCan, is today possibly the only governmental statistical service in the Western world that has no idea of its national marriage or divorce figures.

Having to face economic constraints has meant ditching the collection of some key information and the management appears to have selected marriages and divorces straight and gay.

Curiously, however, a glance at their web-presence shows they still track and collate far more frivolous data. So one is left wondering what other essential data collection performed today will, one day in the future, be left to wither on the vine ?

Compared with the old StatsCan, the new StatsCan looks positively bankrupt. Although the bankruptcy is more metaphorical and a personal opinion than actualitie, it is has to be recalled that the old  StatsCan was sent reeling by a loss of Canada_1integrity of some years ago. The genesis of this was when DV was ‘flavour of the month’ everywhere (in around 1994), and it was a situation compounded by some very obvious gender biased interpretation of data and events. 

For example, in those days Statscan published only female DV statistics. It had to be cajoled into citing males victims, i.e. both genders. Statscan also used to quote “reported” DV events as opposed to ‘convictions’ (or even corroborated incidents), which obviously inflated the DV numbers. Given this eager feminist mindset, it could be said to have fallen over itself in rushing to produce glowing statistics of Gay Marriages when they were legalised in 2003 (in Ontario and British Columbia provinces only initially). [2]

Additionally, by 2009 StatsCan had for some years been criticised as being too easily ‘swayed’ by Political Correctness and domestic political considerations – the more so when one considers such influences on the staff they were training for many foreign statistical bureaux.’  One also has to fear for any resulting statistical [in]accuracies and bias.

Gay Marriage

Gay Marriage has a longer history in Canada than most would suppose and if the same ‘evaporation of demand’ was to be demonstrated the Canadian data would be able to confirm it.

A variety of Canadian websites sponsored by government or state agencies attest to their pride in being progressive, liberal and among the first to legalise same-sex marriage.

Table 1 (above) shows the cumulative total, by province, but it should be underscored that these are not annual totals but historic cumulative ones dating back to 2003. So one wonders if, for instance, the Yukon saw a steady one per year of a spurt in year one and two and then very few afterwards.

Explaining the data deficit

In an email correspondence with a Consulting-Analyst of ‘Statistics Canada’, it quickly became apparent they were in no position to assist in finding the hidden data on Gay marriages – because they no longer collected any annual data on marriage numbers at the national level. Some key sentences in their replies are shown paraphrased below:

  • After the release of the 2008 data StatsCan discontinued collecting marriage or divorce statistics.
  • Even at the time, data quality was ‘suspect’ because the records included a large proportion of “Not Stated” for type of marriage. Therefore, in the tables prepared 2005 to 2008, marriage by type was excluded . . . .  we do not have any marriage or divorce statistics subsequent to 2008. 
  • The 2011 Census data which might have provided an alternative source, not only ‘over-estimated’ the number of same-sex marriages by a several thousands, but showed only a cumulative figure, i.e. all gay marriages from 2004 to 2011 [ so there were no annual figures].
  • There are no annual figures for heterosexual marriages.
  • The number of people/couples who did not indicate on their marriage licence what type it was, must be significant since a small discrepancy could normally be covered by a “cautionary note/footnote,”

It is difficult to understand why, when data such as marriages and divorces are so an essential and basic commodity that it Canada_2should be decided to discontinue them – particularly when other nations also facing the same recession still collect such information.

One would have thought that government would have relied on StatsCan to provide a wide range of up-to-date basic data for planning purposes.

The decision not to publish marriages numbers since the 2005 ‘errors’ must mean the data reliability concerns within StatsCan must have been severe.

The advice received from StatsCan, re: Gay Marriage numbers, was to approach each of the provinces individually – ‘as they might collect the data.’

There are in fact 13 provinces in Canada the biggest is Ontario (see Table 1 above), but not all of them collect Gay v Straight marriage numbers. Canada has a population of approx 35 million (2011), and in a worst case scenario if data could be found for at least 50% of the 35 million one might make tentative projections. (See Appendix 1, below, for a full list of Canada’s 13 provinces).

Fortunately, three provinces alone contain 74% of Canada’s population and the top 4 provinces contain 84%. However, the most populous, Ontario, is one of the provinces that does not collect, or does not display, marriage and divorce statistics.

Unfortunately, although the biggest province, Ontario, has not collected marriage data since around 2005 we do on the other hand have both Alberta and British Columbia which collect annual figures for same-sex marriages (see below). Having lost Ontario (at 38% of the nation’s population), only the remaining British Columbia (13%) Alberta (10%) and Quebec [3] (23%), are of significant size to form an approximation – and even here data was not consistent.

Of these three, Quebec appears to have no statistical record that can be interrogated which leaves only British Columbia and Alberta, representing a rump of only 23% of Canada’s population.

Sadly, even Canada’s newspapers can shed no further light on the actual annual numbers as this extract (from the Huffington Post) exemplifies: [4]

  • “In all, there were 42 per cent more same-sex couples counted in 2011 than in 2006. The Census recorded 64,575 same-sex couples compared to 45,350 in 2006 and 34,200 in 2001, when Statistics Canada first began noting same-sex common law relationships.
  • Same-sex couples accounted for 0.8% of all couples in 2011.

2. Limited data

Before delving into the national Census which does show same-sex marriages – albeit cumulatively – it is perhaps worth looking at data from specific provinces and then compare the overall picture gleaned in the main from Census returns.

British Columbia

The following annual totals are drawn from data made available by British Columbia from 2003 to 2011. Regrettably British Columbia’s records are not annual but appear to be biennial. However, taken overall, British Columbia is perhaps the best example of a province providing comprehensive annual data.

The first grouping with a sub-total of 1,470 represents the ‘total number of same-sex marriages’ performed in 2003. The second sub-total of 643 is the number of Canadian, regardless of origin (e.g. from Quebec, Ontario, Alberta, etc), who were legally married in British Columbia.

Canada_3

The third grouping “Overseas Total”, are those same-sex couples from outside Canada who travelled to British Columbia to be married.

Translated into a graph (see below), the initial surge created by starting from zero can be seen to be followed by a tailing-off in demand A trend line has been superimposed for ‘Total Same-Sex Marriages’ but all the other sub-sets, i.e. Total Canadian, Total Female and Total Overseas all decline after 2005 which must be seem as British Columbia highpoint.

Graph 1. British Columbia. Same-Sex Marriages, by prior residential locality (actual numbers and trend line).

Canada_graph1

One also has to assume that the falloff in overseas is inevitable and in large part due to the legalization of same-sex marriage in other countries.

Other early statistics from British Columbia dates from 2003, and shows ‘same-sex’ marriages by place of residence but only by proportion and not discrete numbers (see Table 4 below).

Canada_4

In British Columbia, people who married someone of the same-sex had an average age at first marriage of around  13 years more than people who married someone of the opposite sex.

Thus, in British Columbia, the average age at first marriage (for same-sex couples) between men was 43.9 years, and for women it was 41.6 years. However, the average age at first marriage (for opposite-sex couples) was 31.0 years for men and 28.8 years for women. This is the level of detail not found in any other province.

Alberta

Data available from Alberta is annual and stretches from 2005 to 2011. Again we find the numbers are in the low hundreds rather than the thousands which is the impression given by StatsCan and their 2011 Census returns. Alberta legalised same-sex marriages on July 20th 2005.

For some reason Alberta chooses to call same-sex marriages, “same gender” marriages. 

The presentation is not as clear as for British Columbia’s. The data below shows marriages numbers depicted at Table 16. Although Table 14 and 15 also show same-sex marriages they are laid out in age groupings and not distinct genders (see Table 5 below). 

Canada_5

Only ‘Totals’ have been here used because Alberta does not distinguish between male same-sex marriages and female same-sex marriages. Confusingly, the Alberta method is to create a matrix where categories such as “Divorced”, for example, appear on both the vertical and horizontal axis but the numbers do not always tally save for the Totals column – which is the data used here.

Graph 2. Alberta – Same-Sex marriages by prior declared marital status.

Canada_graph2As can be seen from the Table 5 above, the total number of same-sex marriages started off at 138 in 2005 (against a backdrop of 17,762 total marriages in the same year), equivalent tor 0.77%, and had, by 2011, had fallen back to that same level of 138. This is also shown in graph format (above).

Alberta appears to have attracted, or been able to cater for, only 10% of the numbers choosing British Columbia’s for a same-sex marriage. Alberta’s graph peaks on the ‘Y’ axis at just over 250 pa, whereas British Columbia’s peaks at 2,000 pa for the same year.

Alberta did not gain from being a pioneer of same-sex marriage so there is no apparent peak or ‘spike’ in the first few years of 2005 or 2006 – usually associated with fundamental reforms. However, Alberta did have an increase in 2006 and did manage to maintain a relatively high level until a collapse in 2012. Why this should be is not explained in any of the notes or commentaries that have so far come to light.

Ontario

This is the most frustrating province when searching for Marriage Statistics. All search permutations bring forth only Marriage Licence information and how to get a copy of a lost licence, the requirements for a legal marriage etc, etc.

In an email reply (Aug 2013) to my request for data from Service Ontario with regards my “interest in vital statistics” they stated that:  

  • “Currently, we have limited resources to respond to data requests.
  • Please be advised that we cannot respond to your request at this time. 
  • We invite you to re-apply in 3 months’ time by emailing data@ontario.ca .”

However, for one year only – in 2003 – the City of Toronto issued datasets which captured statistical information about marriage, including same-sex marriages.[5]  But take care – this data (see below) is little more than a snapshot of one month. It is just a glimmer and nothing more.

Canada_6Save for this exception (i.e. Table 6), Ontario, where Toronto is by far the biggest city, does not produce any marriage statistics – and certainly not by gender.

Without Ontario’s inclusion British Columbia and Alberta make up barely 23% of Canada’s population (i.e. 7.7m). This is not sufficient a base from which to make any reliable  predictions or extrapolations.

Idiosyncratically, Ontario’s marriage registration forms do not contain information allowing the type of marriage (opposite-sex, male and female same-sex marriages) to be identified. Enquiries made of Ontario’s statistical service revealed that a privatised company now appears to be in charge of matters. My enquiry was forwarded to:

  • “Thunder Bay Production and Verification Services Branch [or TBPVSB for short], and formerly the Office of the Registrar General.”

One of the emails received from Ontario’s statistical service (Aug 19th 2013) made clear that this company now records not only marriages but the registration of; name changes, births, deaths, and those who can perform marriages in Ontario.

In the mainstream media it is almost as if Europe and Canada are orchestrating the echoing one another’s mantra’s with newspapers and official statistical services sharing the same narrative and sub-text. They wax lyrical about the growing numbers of same-sex marriages. For instance, a headline in Canada’s Global News ran “Number of gay marriages in Canada triples: census”, adding: [6]

  • “They are part of an exploding number of same-sex couples saying “I do” in Canada – a right first recognised nationwide in 2005.”
  • ‘The number of same-sex married couples has tripled in the past five years, according to figures released figures by Statistics Canada on Wednesday.’

But there is something that sets this commentary apart from the reality and that is the undisclosed annual figures. Citing cumulative numbers will always be impression over a 10 year period but also always misleading. This is most pronounced is the Canadian Census figures which appear to be the only source of national same-sex marriage data.

Canada_Marr

Chart 1. All Canada. Marriages (1921 – 2008)

Something else that sets this commentary apart from reality is the disguising by distraction of the near-terminal decline in marriage rates generally. The chart above depicts this collapse in graphic terms. One can only imagine that the period 1930 to 1940 saw an economic boom resulting in increased marriage rates. What is not so clear is why after the Korean War marriages should have declined ? Equally, what triggered the increase seen between 1960 and 1970 – and what then sparked the present decline from 1970 to 2008 ? A pivotal year appears to be 1970. But had it anything to do with the “Charter of Rights and Freedoms” of 1982 (see ‘Postscript’) ?

Quebec

Among Canada’s big 3 provinces it is Quebec that shows the most strains and the most social unraveling. Taking a few key indicators such as single adults and single-parent-household (aka SMH), and the number of cohabiting couples as a  ratio of married couples, it is the most troubling and dysfunctional.

To date no Québécois annual same-sex data has been found but the 2011 Canadian Census for Quebec’s marriage and ‘conjugal status’ is shown below in Table 7. [7]

Canada_7It must be recalled that these total are all cumulative, not annual. Combining the ‘same-sex married spouses’ with the ‘same-sex common-law partners’ category gives rise to only 2.56% of total opposite sex marriages and couples and which is substantially lower than the national figure of 3.346% (see above).

3. Relying on the Census

The first Canadian census to count same-sex marriages was in 2006, and so it should be no surprise that increases of “32%” have been realised by 2011.

Though it has been mentioned before, citing cumulative data will always be impressive taken over a 10 year period. But misleading too when talking of same-sex marriages is to state that:

  • “The trend is striking when in comparison the marriage numbers for Canadians in general”

This refers to only a rise of 2.9% in the number of married heterosexual couples. However, working from a far larger base any increase will look marginal and this is only to be expected. Thus the comment is deliberately misleading and of no value.

What is of interest in the Census of 2011 is that twelve per cent (12%) of married same-sex couples now have children, along with 8% of same-sex ‘common-law’ partners.

Other 2011 Census Bullet Points include:

  1. Same-sex couples accounted for 0.8 per cent of all Canadian couples, compared to 0.7 per cent in Australia, 0.4 per cent in the United Kingdom and 0.6 per cent in the United States.
  2. Same-sex couples accounted for 0.8 per cent of all Canadian couples, compared to 0.7 per cent in Australia, 0.4 per cent in the United Kingdom and 0.6 per cent in the United States.
  3. Marriage still remains the minority for same-sex couples.
  4. The 2011 census enumerated 21,015 same-sex married couples and 43,560 in common-law relationships

Table 8, below, is an abbreviated form showing both married and non-married couples. Though they are cumulative and not annual figures, they usefully show the divide between ‘opposite-sex married spouses’ and ‘same-sex married spouses’ which represented only 0.3% even after so many years of legalisation. [8]

Canada_8Table 8 also shows that Canada’s Census not only counts but distinguishes between the various forms of ‘Common-law partnership’, e.g. opposite-sex and same-sex (the later shown in red and giving a gross total of 3.346%).

The following Table (Table 9) shows an abbreviated array of the number of heterosexual female marriages and ‘common-law’ arrangements, together with female only homosexual marriages and partnerships (unions), and proportions, also revealed by the 2011 Census. [9]

Canada_9
  • An aside: The types of union possible between heterosexual couples are; 1/. spousal, i.e. formally married, 2/. common-law partnerships or 2/. unscheduled cohabiting. Common-law marriages has never existed in England. but cohabitation has. In recent years it was the intent of Britain’s Law Commission to abolish any distinction between spousal and cohabitee rights when divorcing (ref. the state’s power of  property theft).  This would severely have circumscribed an individual’s freedom of choice.

Saskatchewan

In keeping with most of Canada’s provinces data from Saskatchewan is patchy. During 2009 there were a total of 5,111 marriages were solemnised in Saskatchewan. This represents a crude rate of 4.9 marriages per 1,000 population.

Of those 5,111 marriages registered in Saskatchewan in 2009, 29 of those marriages were between same-sex partners, or 0.56%.

In the same year, 2009, a total of 1,976 divorces were registered in the province (though this may not represent the total number of petitions filed in 2009, as some petitions may not yet be finalised.

Canada_10During the year 2007, a total of 5,235 marriages were solemnized in Saskatchewan. This total represents a crude rate of 5.2 marriages per 1,000 population. Marriage rates for Canada, the provinces, and Saskatchewan for 2005 are given in Table 10. Of the 5,235 marriages registered in Saskatchewan in 2007, 26 of those marriages were between same-sex partners (see graphic below). [10]

Graph 3. Saskatchewan – same-sex partners 2005 -09

Canada_graph3For the year 2005, a total of 5,121 marriages occurred in Saskatchewan. This total represents a crude rate of 5.1 marriages per 1,000 population. Marriage rates for Canada, the provinces, and Saskatchewan for 2002 are given on the next page for comparison.

Of the 5,121 marriages registered in Saskatchewan in 2005, 50 of those marriages were between same-sex partners.

Although there is little data to process with confidence it would appear that the same ‘flash in the pan’ effect seen in Europe is also at work in Saskatchewan.

Whether Canada’s legally recognised ‘common-law’ unions represents a 4th option is not clear.

From Canadian data it is clear that more people over the age of 15 are single rather than married or living as a couple. Similarly, more people cohabit than marry in Canada – especially in Quebec. Overall, a total of 147,391 Canadian couples were married in 2003, only 653 more than in 2002 and just 773 more than in 2001, according to vital statistics data from the provinces and the territories, which for the first time include limited information on same-sex marriages. [11]

StatsCan publication, “2011 Census of Population: Families, households, marital status, structural type of dwelling, collectives” (pub 2012),  identifies Nunavut (at 32.7%) and Quebec (at 31.5%) as the two Provinces with the highest rate of common-law couples. High proportions of common-law couples were also found in the Northwest Territories (28.7%) and Yukon (25.1%), which might indicate a link that distance from large unban amenities and pressures to conform (the ‘Wild West’ factor) may play a role.

Repeatedly, one finds in official statistics and where same-sex marriage data is supposedly available it is unhelpfully expressed as ‘percentages’ (but of what ?), as any brief examination of StatsCan quickly reveals.

But rather more helpfully at this particular URL the commentary continues to reveal that:

  • “Of the 21,981 marriages that occurred in British Columbia in 2003, 774, or 3.5%, were between people of the same sex.”

Of the 774 same-sex marriages in British Columbia, 422, or 54.5%, were female couples and 352, or 45.5%, were male couples. [12] Additionally, because we are dealing with 2003 data and British Columbia was one of the first places to legalise same-sex marriage, plus Canada, in 2003, was the only country in the world that allowed same-sex marriages between people who were not residents of its territory, we also learn that :

  • “More than half (55.9%) of the people who entered into a same-sex marriage in British Columbia were not residents of Canada.”

4. Cumulative Census Data

We have to wait until the Census of 2011 for a breakdown in same-sex marriages – albeit cumulative in nature and therefore not comparable with European data.

Table 11, below, crucially displays that among heterosexual couples there are far more who are married (12.5m+) than are living as common law partners (3m+). However, among homosexuals, at 42,000 same-sex marriages (male and female) they represent only 0.33% of the ‘Opposite-sex married spouses.’

Canada_11JPG

The above Table depicts the overall picture as at 2011 and of both sexes regardless of their gender orientation. [13] However, Table 12 (below) shows how many men (Gay and straight) were married or in a relationship. [14] 
Canada_12

Comparable figures for lesbian marriages, ie female same-sex marriages, are shown in Table 13 below. If anything same-sex common-law partners among women slightly out-number male homosexual common-law partners in percentage terms, ie 0.63% as opposed to only 3.1%. But in concrete numbers, male same-sex marriages at 23,080 outpace lesbian marriages at 18,955.

The reader’s attention is drawn to the varying percentages in both Tables 12 and 13. Table 12 shows that among males same-sex unions there are 8 times as many common-law partnerships as there are same-sex marriages (expressed as a proportion of a).all spouses and b) all common-law unions). Given that there is little difference in state recognition and inheritance taxes etc as applied to common-law unions, one wonders why the discrepancy is so large (3.1% vs 0.36%). Secondly, one wonders why it was thought essential to use parliamentary debating time to push through same-sex marriages (other than to make a political point).

On the other hand, reader’s may have noticed a discrepancy in Table 13 which shows that among ‘female’ same-sex unions there are only double (not  8 times) the number of common law partnerships as there are marriages – as expressed as a proportion of a).spouses and b) common (0.6 vs. 03). [13]

Canada_12a

And while same-sex marriages have been available to both men and women since 2003, male   same-sex marriages numerically predominate, at 23,080 vs 18,955. The same appears true of male versus female same-sex common-law partners.

Canada’s overall population, by marital status and sex for the years 2008 to 2012 inclusive are shown below in Appendix 1.

An interesting comment found in a StatsCan commentary points to a ‘provincial court rulings in 2003, vital statistics registries in Ontario and British Columbia’ started to register marriages of same-sex couples. So quite why Ontario doesn’t collect vital statistics but British Columbia does is a mystery.

The same Note also states:

  • “Marriage statistics by sex are not available for Ontario as the province does not identify whether a marriage is opposite-sex, male same-sex, or female same-sex, or the sex of the person getting married. Any national marriage statistics presented by sex for 2003 excludes Ontario data.”

Without the 2011 Census of Population we would be unaware that there was a total of 64,575 same-sex couples in Canada in 2011, of which 21,015 were married.

To arrive at a very inaccurate estimate of the annual number of same-sex marriages we can crudely divide the 21,015 total which would give us a figure of 2,627 pa

But as StatsCan states elsewhere, ‘these data should be used with caution’ in the main due to a miscalculation of between 0 and 4,500 is assessing how many same-sex couples actually existed (apparently 2 men or more sharing a college dorm where wrongly classified). However, StatsCan says “This does not affect the quality of other data from this release.”

 New Zealand

This is the latest country (Aug 2013), to adopt same-sex marriage. However, with a population of only 4.4 million and a probable 2% of the population ‘Gay’ (ie homosexual or lesbian), this fives rise to 88,000 individuals who might take advantage the opportunity. (See Table 2, British Columbia, Pop’n 4.4m).

Using the same very basic calculations (2% x 35m), Canada would have a latent pool of 700,000 of ‘Gays’ in it’s population – but as we can see from the cumulative Census data nowhere near that number are in either same-sex marriages or same-sex common-law partners.

Nonetheless, we should expect that a ‘spike’ in New Zealand same-sex marriages will occur in the first 12 months, followed by a tailing off. The only factor that may prolong the surge might be an influx of Australian same-sex couples seeking marriage.

Postscript

To the question, “Why has there been an apparent surge in same-sex marriages around the world”, the answer has to be the legalising and enforcement of equality.

The mother, father and midwife of ‘equality’ legislation perhaps never thought to what ends their liberal views and ambitions could be bent. Having given ‘all men’ the same and equal rights it is surely natural that those with a proclivity or deviant behaviour would seek to avail themselves of those very self-same equal rights. If so – and if that is the rationale – how long will it be before paedophiles will demand of Society the same rights, the same ‘equal treatment’ which the  majority of us now enjoy and take as normal life and values ?

In the case of Canada, having ditched their English common law heritage in the 1980s the country has been at the mercy of its rather feminist skewed “Charter of Rights and Freedoms.” This was part of a process that began in 1960 with the “Canadian Bill of Rights” culminating in the efforts of a somewhat leftish-feminist Prime Minister, Pierre Trudeau to get the Charter adopted in 1982.

Equality for all – and in all matters – was enshrined in the charter which the Supreme Court could enforce without reference to precedent, culture, heritage or tradition. Was any thought given to Gays and Lesbians in 1960 – no, very little one suspects. Who in those days would have imagined it being used in the way it has to establish Gay Rights by 2003 ?

In 1952 psychiatrists and the Diagnostic and Statistical Manual of Mental Disorders (DSM), published by the American Psychiatric Association (APA) listed “homosexuality” as a sociopathic personality disturbance, under the general heading of mental illness. It was also a criminal offence. To overturn these barriers took many years (see Appendix 3). In Britain, homosexuality had limited de-criminalisation by the Sexual Offences Act 1967 – so long as the homosexual acts were in private and between two consenting adults.

Therefore, before paedophilia can have any hope of acceptance by professionals, i.e. psychiatrists and thus Society, it will first have to be removed as a sexual  deviancy from the DSM and then the second hurdle is to have their sexual proclivity “de-criminalised.” All this looks impossible and too fantastic for words now but there is a precedent that has already been set.

And so it is with Europe. The many EU Treaties contain provisions for equalities in all matters and thus ‘reforms’ filter out of Brussels and into national legislation. There is simply no option for national governments, and to deny it would be to discriminate against a section of society. Had Britain not signed these Treaties then, in common with Russia, we could have devised our own regime and sense of equality – perhaps as originally intended

Following the 2011 Census newspaper headlines in the Canadian Press revealed that: 

‘Census may have counted roommates as married gay couples’ (Sept 19th  2012)

  • An unexpectedly high number of same-sex marriages in places like the oilpatch left census-takers scratching their heads — until they realized many of the “couples” were only splitting the rent.
  • As a result, Statistics Canada said Wednesday, it may have overestimated by as many as 4,500 the number of same-sex married couples in parts of the country.
  • A last-minute discovery forced the agency to hold back some census data on gay and lesbian married couples when they realized they couldn’t be certain if some people were hitched or only roommates. ( http://www.cbc.ca/news/canada/story/2012/09/19/census-same-sex-marriage-family.html).

Sadly, what has changed over the years in Canada is an aggregation of distinct data groups. Thus, one finds a StatsCan comment such as “Inclusion of same-sex as married.”

In other words there has been a persistent and continued homogenisation of family law to treat married couples and common-law couples uniformly (Ref: the recent “Lola” case in Quebec upset the trend as Quebec remains the only province not granting spousal maintenance to common law).

E N D

Appendix 1

List of all 13 Canadian provinces by population size, as at 2011 Census.

 Canada_14

Appendix 2

Out of a total population of 34,880,491 (34.8m), in 2012, there were 13,833,655 individuals (13.8m) who were married (men and women), meaning there were 21,046,836 who has some other marital status.

The largest of these groups was the “Singles” who  very nearly numbered the same as married couples at 13,788,492 (13.7m).

When StatsCan states there to be more ‘singles’ than married individuals in the country this must be based on including those who are; divorced (1,690,074); those who are widowed (1,798,662) and those Separated (767,550) .

These sub-groups total 4,256,286. However, as in the UK some of these might be undeclared relationships.

The reader will have noticed that the 3,002,058 living in ‘common law’ relationships have not been included. This is because the author takes the view that this is comparable to cohabiting statistics in the UK which are a ‘flow variable’, i.e. transient, rather than a stock variable which is the categorisation applicable to the other sub-groups. In practice cohabiting barely lasts 2 years before it breaks up or moves into marriage, or into another adult relationship.

Canada_13

Appendix 3

The Diagnostic and Statistical Manual of Mental Disorders (DSM), is published by the American Psychiatric Association and provides a common language and standard criteria for the classification of mental disorders

Influential for the acceptance of homosexuals as normal human beings was a study conducted by a psychologist (Evelyn Hooker), in 1956 that compared the happiness and well-adjusted nature of self-identified homosexual men with heterosexual men and found no difference. (“Homosexuality: A Psychoanalytic Study of Male Homosexuals”).  This was hotly contested by others in the field as well as by homosexual men themselves who, like obese people always feel they have to justify their condition, confessed to morose feelings (the morbidity alcoholism and suicide rates bear out this last view).

In 1957 homosexuality was nowhere to be seen on the public’s radar screen when the  Wolfenden Report came out that year and suggested consenting homosexual sexual acts between homosexual adults “in private” should no longer be a criminal offence in Britain. It was to be another 10 years before any government had the nerve to incorporate homosexuality into an Act designed to deal with street prostitution (the Sexual Offences Act 1967).

Meanwhile the homosexuality debate was reaching fervour pitch in the US. Badgered by activists the APA caved in and by in 1974, DSM-II edition  no longer listed homosexuality as a category of mental disorder in anything but extreme cases. It is tragically ironic to now realise that data presented  from the researcher Alfred Kinsey – who we now know corrupted data to suit his own sexual orientation – was accepted as persuasive, and we can only suppose that others supporting the de-listing might also have had ulterior motives.

Footnotes:

[1] Gay Marriage Facts and Statistics Source: 2000 Census.

[2] It is perhaps interesting to note that it was a minority government which introduced the Canadian legislation in 2005, and one wonders if a weakened Coalition in the UK also paved the way for the same legal change ?

[3] Quebec, despite being mainly Catholic legalised same-sex unions in 2002. And yet “the number of same-sex couples surged 32.6% between 2001 and 2006” – http://www.statcan.gc.ca/daily-quotidien/070912/dq070912a-eng.htm

[11] See http://www.statcan.gc.ca/daily-quotidien/070117/dq070117a-eng.htm

[12] See http://www.statcan.gc.ca/daily-quotidien/070117/dq070117a-eng.htm

[14] See http://www12.statcan.gc.ca/census-recensement/2011/dp-pd/tbt-tt/Rp-eng.cfm?TABID=1&LANG=E&APATH=3&DETAIL=0&DIM=0&FL=A&FREE=0&GC=0&GK=0&GRP=1&PID=102574&PRID=0&PTYPE=101955&S=0&SHOWALL=0&SUB=0&Temporal=2011&THEME=89&VID=0&VNAMEE=&VNAMEF=

[15]  See http://www12.statcan.gc.ca/census-recensement/2011/dp-pd/tbt-tt/Rp-eng.cfm?TABID=1&LANG=E&APATH=3&DETAIL=0&DIM=0&FL=A&FREE=0&GC=0&GK=0&GRP=1&PID=102574&PRID=0&PTYPE=101955&S=0&SHOWALL=0&SUB=0&Temporal=2011&THEME=89&VID=0&VNAMEE=&VNAMEF=

Population prediction proves true

by Robert Whiston   Aug 2013

yes_yesHow sweet is the sensation of one’s prediction coming to fruition ?  Prediction is a powerful tool – especially when against all the odds, against mainstream thinking, a prediction made in 2006 comes true in 2013. This is as good as getting the Home Office to accept – via the Stern Review –  that they had their rape statistics and definitions mixed up.

This week, Aug 2013, has seen announcements in the national media that Britain is undergoing an unexpected population and birth rate increase with headlines such as:

 ‘More UK births than any year since 1972, says ONS’

BBC news [1]

Baby boom drives UK population growth

Financial Times [2]

The reason why this is so pivotal is that since 2006 a plethora of changes of near-galactic proportions have been implemented on the back of the single assumption that the population and birth rate would decrease. Almost without exception, every other EU country has seen its population either stagnate or decline. The fact is, at this early stage, no one is quite sure why the population has increased. However, the list of policy changes and the resulting invention of new policies is as long as your arm – they go on and on – but here are a few examples:

  • Pension provisions have changed, the age of entitlement has changed – no longer is it 65 and a single-tier pension is to be introduced.
  • An entirely new employment Stakeholder Pension has been created.
  • The new Universal Credit has been introduced to replaced Job Seeker Allowance, Income Support, Child Tax Credits, Working Tax Credits, Housing Benefit.
  • All state welfare benefits  have been ‘capped.’
  • Legal Aid has been severely curtailed causing policy changes in an array of legal fields which were once based on this assumed funding.
  • State funding for divorce and child maintenance are too expensive to continue to operate in their present form.

The Pensions Commission Report, chaired by Adair Turner was published in 2005. It concluded that the present regime was unsustainable and that ordinary working men and women will have to work for more years, and or pay more in taxes and still be expected to accept less in pension benefits. However, I had followed the fund flows into the National Insurance Fund for 20 years and knew it could operate successfully without great reserves said to be required.

Nonetheless, everybody ‘bought into the idea’ of an impending crisis – and this was well before the financial crash of 2008-09.

Turner’s report made the point that by 2035 pensioners would suffer a 30% drop in real income compared with pensioners at the present time (Adair Turner is now Lord Turner of Ecchinswell).

In an editorial, the Daily Telegraph (13th Oct 2004) emphasised how British pensions were already poorer than EU equivalents: Germany, Holland, Italy and Luxembourg gave about 85-90% of median income to pensioners – UK about 65%. [3] The EU average was just over 80%. Ireland was bottom with just over 60%. Currently, the UK then spent 6% of GDP on state pensions compared with 11% EU average. The official response to this was that these countries had been ‘over generous.’

But by 2013 we have wages that are not increasing, or at best increasing by 1% pa, work hours being cut and inflation  officially put at about 3% (but more likely 9%). So deflation and purchasing power of even those in work is falling at 2% or more a year.

Genesis

The story begins in the early 2000s when dire prediction were being made about the unaffordability of state pensions. The fear in 2003 was that old people would, by 2020, outnumber young workers, with the result that the ‘tax take’ from these young workers would not be big enough (the tax base), to meet the demands that state pensions and other state supplied services needed for the retired and low-income classes.

Contrary to the Turner Report into pensions which created panic among the political classes, I predicted there would be an up-swing in the population, probably due to an increased in the number of children born (and not due entirely to more mass immigration) between 2010 and 2020 (NB. Adair Turner was formally deputy chairman of the investment bank, Merrill Lynch, Europe – part of Bank of America which had to be bailed out with public money in 2008). In 2006 I wrote that:

  • “Although both births and fertility are presently at a nadir there is no reason to think they will remain there, as Fig 5 (below) exemplifies. Economic circumstances and fiscal incentives can and do cause birth rates to fluctuate.”
  • Accepting the population trends found in ‘National Population Projections 2002-based’, England alone is best placed to cope with old age and paying pensions. Its birth rate and population alone is expanding, and by inference a growing population, working and paying into the National Insurance Fund, with Wales and Scotland static, i.e. increasingly ageing.

The implication, therefore, was that even in 2006 amongst all the figures and conflicting data there was reason to detect a feeble, if marginally expanding population (but only in England) and all that was needed was encouragement or a change in circumstances to ensure its momentum.

Pre-Millenium trend

In a paper to Conservative Central Office dated Dec 15th 2005, I cited the opinions of Elisabeth Croll, an expert on Asian demography, and Jean-Claude Chesnais a leading French demographer. [4]

  • “We now recognise from the experience of economies in SE Asia that a growing population is a precursor for economic growth.“

Prior to that the conventional wisdom was that advanced societies could only look forward to declining populations and less than replacement fertility rates (shown here as Figure 6.1), Fig_6.1followed by stagflation. Japan being a prime example of this.

The ‘completed family size’ rate (CFS) had been since the 1980s ever downwards all across the West – falling in the case of Britain from the now famous ‘2.4 children’ to under 1.8 children per family unit. Of course, it has to be said that the academic views of Croll and Chesnais overlooked the high rate of unemployment in those South East Asian countries, e.g. Philippines, Indonesia.

In Britain a certain panic gripped mood-setters in society and forced pensions onto every political party’s agenda.

The then current moral panic regarding pensions impacted not just the UK but the West and overseas too, particularly the US and some EU countries where the fund set aside for state pensions was already in a parlous, i.e. non-viable, state. Some countries, like Australia, had acted far earlier.

There was a great fear that the ‘worker-to- pensioner’ ratio would explode. The ONS termed this the “Pensioner Dependency Ratio.”

By focusing on projections for 2030, politicians allowed a sense of impending crisis to overwhelm the media and this obviously   influenced the public’s perceptions of what was going on.

Pen_ratioHad politicians not neglected the trend from 1900 to 2000, when the number of people of working age for each person over state pension age fell from 14:1 to 3.5:1 the alarm would have been seen as the hiccup it was and not as a drama. Incidentally, the ratio trend was predicted to fall to 2.5:1 by 2040 so to even an untutored mind this age-based support ratio is not only less steep than recent history but should comfortably be manageable.

‘Population Trends’ (Spring 2004, page 11, Table 4), showed the ratio between those of working age (16 – 65) and those of pensionable age (over 65).  The ratio is constant from 1981 to 2002 at approx. 3:1 (36m v 10m 2002).  In 2026 this was expected to be 39m v 13m, and by 2031 38m v 15m (33% and 40% respectively).

In addition, as can be seen from the Table below there was no actual or inherent surge either in the total numbers  56,352k [1981] ; 57,584k [1991] ;  or 60,057k [2001], or in those age over 65, i.e. 8,130k,  7,897k, and 7,602k, for the same respective years.

Pop_proj

Perhaps key was the upward trend among those aged 0 -14, from 11,602,000 in 1981 to 12,085,000 by 2001.

The great pension robbery

By July 2009 parliament was debating a National scheme for the upkeep costs of pensioners and the care for old people (Hansard Column 393 http://www.publications.parliament.uk/pa/cm200809/cmhansrd/cm090715/debtext/90715-0019.htm).

The nominal ‘face value’ of pensions paid by the state have increased year on year as the Table below reveals. However, the real ‘Purchasing power’ has decreased year on year. It is probably fair to say that the £90.70 payable in 2008 was barely comparable to the £43.60 paid in 1969.

State_penTheoretically, with an expected retirement age of 65 for both men and women (following an ECHR ruling overturning the 65 – 60 split), and an expected life expectancy for women to be 85 and 75 for men, women therefore have 20 years of pension life ahead of them and men only have 10 years.

The cost to the taxpayer then looks like this:

  • Using £90 (for a single person) as the standard weekly payment (e.g. 2008 level)
  • Woman – £90 per week x 52wks = £4,680 x 20 yrs = a cost of £93,600.
  • Man – £90 per week x 52wks =£4,680 x 10 yrs = a cost of £46,800.

Had women continued to retire at age 60 then the cost to the tax-payer would have been well over £100,000 per woman.

This gender discrimination (£93,600 vs £46,800.), is further compounded when considering the amount paid in over lifetime with regard mandatory NIC (National Insurance Contributions).

Grasping the nettle

It is now very clear that the UK has adopted the Australian Option.  More than ten years after pension reform its sutuatin has been transformed. In the 1980s, Australia had an ageing population with too few people saving and a state pension of diminishing value. Under half of the population were on company pension schemes.

By the mid 2000s, 95% of full-time employees in Australia had a company pension, compared with only a half in Britain (and most of those have now closed down in recent years).

Australian part-time workers (75% of them) had a pension compared with only 15% in Britain. Prior to the economic crash, Australian pension assets soared in value from A$30 bn in 1980s to A$600 bn by 2005. The possibility of repeating this feat in the UK is now dim, due to Quantitive Easing (debasing the currency). Nevertheless, Australia is now probably in a more favourable position with regards its pension funding than most other Westernised countries.

E N D

Footnotes:


[3] ‘The Pensions Crisis: Adair Turner Report’, October 2004

[4] See Elisabeth Croll,  an expert on Asian demography, and Jean-Claude Chesnais a leading French demographer. http://news.bbc.co.uk/1/hi/programmes/analysis/4305907.stm

Gay Marriage & Unions – an Inter-European Comparison

by Robert Whiston FRSA  June 2013

Quantifying both the public demand and the underlying lack of demand for homosexual marriage among the homosexual community

Same-sex marriage has become ‘flavour of the month’ all across political Europe. Why ?  The crusade – for that is what it amounts to – sweeping Europe is reminiscent of the great Divorce Reforms Acts of the 1969 – 71 era or the more recent tobacco Smoking Ban in public places. For 10 years or more (as Annex 3 shows) the seemingly idiotic idea of two adult men, or women, being able to marry one another has been allowed to colonise our minds.

Is same-sex marriage the new distraction ? Is it being used to replace the old remedy of  foreign adventures to distract a restless populous given that such adventures have proven convoluted, complicated and costly ? This can’t be the answer for most of Europe but it seems a good fit for France and the UK. The argument used to promote same-sex marriage it is that present law discriminates against one section of society i.e. homosexual men and women. But though they may, after a fashion, copulate they have never throughout history expected to procreate and produce children. Until the advent of IVF treatments it has thus been a sterile and time truncated occupation.

At present not only the UK but France is stomaching or digesting – depending on one’s view – having to live with same-sex marriage as a new fact of life but cope with same-sex adoption. Both countries are in more of an economic crisis than is being suggested in their respective domestic media and both countries are already in or being tempted to join foreign escapades.

Both Cameron’s and Hollande’s political career may well look back and rue the day they took this option. They may come to see it as a ‘Pyrrhic victory’, ie one with such a devastating cost that it carries the implication that another such victory will ultimately lead annihilation. Ergo, it is a victory that is not worth winning because the winner losses so much in winning it that it opens the door for others.

In the British example it will probably lead to a Conservative slaughter at the next General Election at the hands of UKIP. What fate awaits the Gallic Hollande one can’t even speculate given that he has the unenviable title of being the President to have lost most public support most quickly. France’s greater love of street demonstrations has seen the same-sex marriage debate ignite otherwise quiet sections of the population. The future should be interesting; Spain’s Nov 2011 general election delivered a landslide victory to the People’s Party, whose leader, Mariano Rajoy, opposes same-sex marriage.

Decay then stability.

Efforts to normalise and incorporate homosexual practices into the mainstream have slowly met with success since the late 1990s. Characteristically, after the initial euphoria of getting same-sex legislation Holland_samesexpassed, numbers that had once shot up soon start to decay. This can be seen in the first graph showing the same-sex marriage numbers in the Netherlands (Holland) when it was legalised in 2001 (Note: same-sex unions, or same-sex ‘partnerships’ were legalised in 1998).

Sweden_samesex
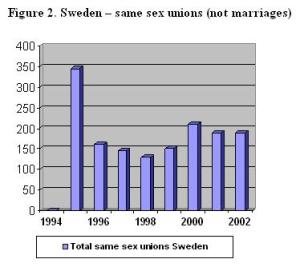
This pattern of numerical collapse is common to many countries where this law has been passed, eg Sweden, UK.

According to Dutch government agency Centraal Bureau Voor de Statistiek (Statistics Netherlands), the number of gay marriages has Figure_3_Eng
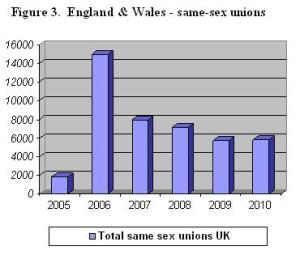
dropped off steadily since the laws came into effect.

Sweden which legalised same-sex unions in 1995 is unusual among “liberal” countries in that it did not legalised same-sex marriage until 2009. (Most countries follow a pattern of legalising Figure_4_swiss
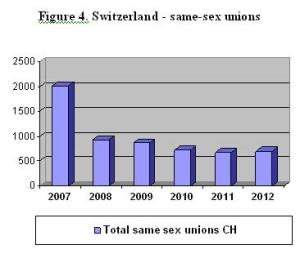
same-sex marriage several years after legalising  same-sex unions / partnerships – not over a decade].

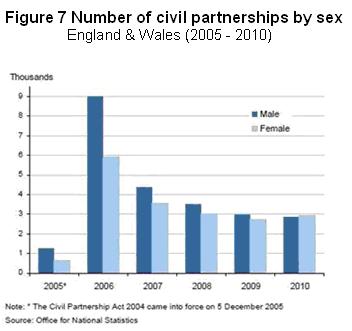
Britain also exhibits the same sudden rise in homosexual unions followed by a steep decay pattern after the legalising same-sex unions. Peaking at  14,943 in 2006 it quickly fell by two-thirds that figure (5,804) in 2010. In the ONS report into same-sex union numbers (Population Trends, No 145), we learn that the state recognised unions in 2004 (but which came into force on Dec 2005), as part of a long-term political agenda:

  •  “. . . thus  fulfilling a long-standing political promise to the Gay community.”

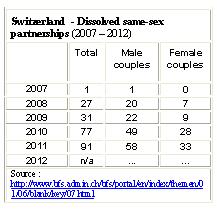
Switzerland which passed a same-sex registered partnerships law in 2005. The fall her has been more dramatic than most – from 2,004 in 2007  to only 695 in 2012.

Pioneers

Holland was the first country to pass same-sex ‘marriage’ legislation in 2001 but it was Denmark which passed the first same-sex ‘union’ legislation in 1989 (see Table below).  Same-sex union legislation appears to be the preferred paving tactic or bridging step prior to pressing for same-sex marriage and the ‘right’ to adopt children.

Statistics Netherlands reports that 80% of its 4.1 million heterosexual couples marry compared with only 20% of Dutch homosexual couples which number only 55,000 same-sex couples. Put another way if heterosexual couples marry did not marry but 20% wanted that right, would that wish be fulfilled by government ? The homosexual “20%” represents a mere 2% of all marriages in Holland. So whereas ‘normal’ marriage is a natural choice for heterosexual men and women it is almost the exception for the homosexual community:

  • Between 1 April 2001 and 1 January 2011, there were a total of 14,813 same-sex marriages in the Netherlands. The number of marriages between two women (7,522) was slightly higher than those between two men (7,291). In the same period, there were 761,010 marriages.
  • During the same period, there were 1,078 same-sex divorces in the Netherlands, two-thirds of them between women (734), and 323,549 divorces in general

The above paragraphs would indicate that overall 7% of same-sex marriages have ended in divorce, but it is higher, at 9.7%, among lesbians (14,813 same-sex marriages / 1,078 same-sex divorces = 7.2%).

In the general scheme of things one source, the Institute for Marriage and Public Policy (Vol. 4, No. 3, May 2011) the number of same-sex marriages in the Netherlands at only 10 % (1 in 10 ), whereas “Expatica.com” (a Dutch international news and communications media company founded in 2000), puts the number at  20% (1 in 5). [1]

Comparing nations

Thus in a 10 years period, same-sex marriages in the Netherlands amounted to no more than one year of same-sex unions in the UK. Given that, one wonders what will be the impact on UK numbers when same-sex marriages are legalised ?  Spain, with a population of 47 million, comes closest to England & Wales (56m), but even here the greatest annual number of same-sex couples who married totalled only 4,500 in 2006 which was the first full year of operation. Thereafter it too tapered off.

Having said earlier that there was usually a time delay between converting to Same-sex Marriages after Same-sex Unions  had been introduced the gaps are inconsistent, as the following Table (Table 1), illustrates:

Eu_by_EU

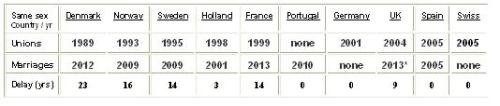
With the exception of a few countries like Portugal and Spain, which go straight to full-blown same-sex marriages, most nations prefer to test the water. There appears to be no set pattern in the yearly wait, ie the ‘delay’ gap EU_mapEU_map_legend

Above: Figure 5gay marriages in Europe by country.

getting shorter or longer, but one gets the feeling that a 23 year wait – as in the case of Denmark – is unlikely to happen again. Moreover, the delay gap would appear to be getting ‘concertinaed’, that is to say more legislation is being passed more rapidly after 2001 with the delay gap falling.

The result, in geopolitical terms, can be see in the map above (Figure 5). Those countries shown in red ‘outlaw’ same-sex unions of any description. Those in ‘grey’ (Russia, Black Sea, Adriatic Sea), do not recognise same-sex unions.

Currently, Norway, Sweden, Iceland, Denmark, Netherlands, France, UK,  Germany, Switzerland, Portugal and Spain have some form of same-sex marriage or same-sex union (see map above). Only ardently religious countries such as Italy, Greece and Turkey are nominally agnostic and have yet to be convinced.  While some form same-sex union is accepted as far east as Hungary, the former Eastern Bloc shown in red, e.g. Poland, and grey have no such provisions or tolerance. Indeed, the red area see marriage as a wholly heterosexual activity.

Where, one wonders, are the Muslim voices who form a significant part of the modern EU’s population ? Any other policy initiative would fist have to pass an “impact assessment” where consideration of their sensibilities towards homosexuality would be assessed and then bought into the discussion. But this has not happened. And to then go on from there to legalise same-sex marriage anyway is to throw the rule book away.

Lesbian ascendency

One of the unintended consequences – apart from the ‘flash in th pan’ number of homosexual males who marry or register a union, is growth in lesbian numbers.

Lesbian_couplesFigures produced by Swedish Stats are shown in Fig 2 (above) and depict the numbers of civil unions by sex from 1995 to 2007. Whereas lesbian unions which were once less than homosexuals ones in 2002 had by 2007 well exceeded them (by over 50%). Official statistics from Statistics Sweden (”Statistiska centralbyrån Forecast Institute”,  Stockholm) state that in:

  • ”2008 was the first time that the number of female registered partnerships was greater than the number of male registered partnerships. It was a minor difference though with 1,223 female and 1,214 male partnership(s).” [2]

Yet as we can see from Figure 6 this is not true. The graphic from ‘Statistics Sweden’ shows 2004 as the cross-over year and 2005 as the first year female partnerships exceeded male ones. The only possible explanation is that Statistiska centralbyrån is referring to the cumulative total over the years 1995 – 2007, i.e. 1,223 female and 1,214 male ‘in toto.’

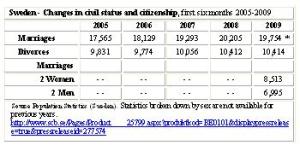
Later Swedish Statistics show that by 2009 there were 8,513 lesbian marriages and Figure_7Bonly 6,995 male homosexual marriages.

This pattern of lesbian overtaking male homosexual is repeated in several countries. In Britain which has a shorter track record of homosexual unions the trend seems to be the same. Once a minority in 2006, Lesbian civil unions Figure_8_Swiss
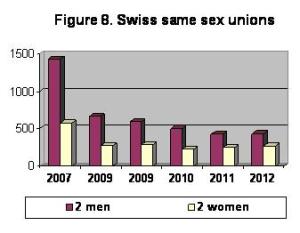
overtook male homosexual numbers by 2010.

However, Switzerland and Spain are presently the odd-ones-out with still more men entering unions than women from 2007 to 2012 and 2006 to 2011, respectively.

Constitutional Crisis

The introduction of a new English law permiting the first born to automatcally become the next monach, no matter what sex they may be , has huge implications that have perhaps not been thought through. If the next first born is a girl and then later marries a man called Mr. Robinson, what will happen to the Windsors ? Are they expected to move out as nore and more Robinson children are born and their relatives take presciodence ? Does he become Co-King, Regent, Cconsort ?

Within the context of homosexuality, it it not unknown for a serving King to be homosexual (e.g. Edward II,  James I), but to do their “duty” by marrying a woman and producing an heir – prefereably with a spare. What potential  dilemma s then lie ahead ? We could hae a homosexual King who marries a another man and adopts a child on the pretence of  contining the royal lineage.  How will the public wear that proposition ? At present, not very well is the immediate answer.

At present it is not possible in England for an adopted child to succeed to the throne – but who says that law will still be standing in 10 years time ?

Conversely, if a girl is sometime in the future the next Queeen, she too could marry another woman and the same scenario of ‘adoption’ would be played out. What are the protocols and terminiolgy, eg the Prince Consort, etc. ?

Significant

Collecting data from the various countries is not straightforward; some countries have missing years, i.e. gaps, some are not as up to date as others, and some sources conflict.

However, there is a discernible underlying tone or tendency to produce cumulative numbers. Reports and articles, especially in Gay publications, often begin with sentences such as these:

  • “In a survey of marriage in Sweden between 1995 and 2002, there were 1,526 gay partnerships registered compared to 280,000 heterosexual couples.”
  • “Since 1 April 2001, when the Netherlands became the first country to legalise same-sex marriage, some 15,000 gay and lesbian couples have tied the knot.”

To the casual observer these appear to be enormous numbers and fully justify the legal reforms. But when ‘annualised’ they are puny with unions and marriages measured in the hundreds and, in the instance of Britain, the low thousands.

Patricia Morgan, in a presentation to the UK parliament, made the following observations:-

  • “Norway moved to ‘gender-neutral’ marriage in 2008.
  • Sweden followed in 2009 and imposed its law virtually overnight without consultation. Since marriage, particularly in Sweden , has long had little or no recognition or status, partnerships morphed seamlessly into marriage and the two have been treated de facto and, for all intents and purposes, as virtually identical – both before and after the transition.”Figure_9_norway

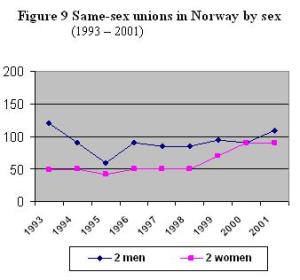
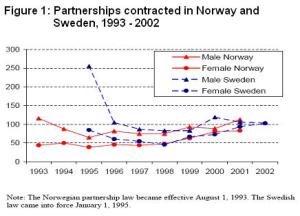
Data from Norway is interesting since same-sex unions have had more time to bed-down. Perhaps it reflect the tentative nature of the radical change (or Nordic restraint) towards same-sex unions but there is no spectacular spike or surge followed by a collapse in numbers as seen in other countries. On the contrary, they have been fairly consistent for almost 10 years.

In countries where there is no public desire for ‘gender-neutral’, i.e. same-sex, marriage it has been imposed on the population from “on high” and against the general public’s wish – which in a democracy is surely an oxymoron, i.e. a contradiction in terms.

On wonders whether the Gay fraternity, piloting this reform throughout the various countries, have any real idea of the downside and the full implications of living a heterosexual lifestyle ? How will they cope with asset confiscation when divorcing ? Or can they reconcile being a parent unable to see ‘their’ child ?

Annex 3 (below) contains a sample of just such tragedies – and there will be far more after the reforms have bedded-in.

Though the following commentary is disparaged by many Gay website it bears repeating here. According to a report of the Institute for Marriage and Public Policy (IMAPP) and based on data from 2004: [3]

  • “There is a high rate of divorce among homosexual couples in Sweden. Gay male couples were 50% more likely to divorce within eight years and lesbian couples 167% more likely to divorce than heterosexual couples. In the Netherlands, between April 2001, when gay marriage was legalised, and December 2003 there were 5,751 gay marriages and 63 divorces.

Next steps

‘Softly, softly catchee monkey’ appears to be the reformer’s “modus operanti”; start with same-sex unions, move on to same-sex marriage, and lastly same adoption of children by same-sex couples. Occasionally, where a country’s laws permit single persons to adopt a child this is avenue is commandeered.

The argument used to promote same-sex marriage it is that present law discriminates against one section of society, i.e. homosexual men and women, and unduly favours heterosexual couples. But though they may consider that they copulate after a fashion (using the primary canal or gastrointestinal tract), they have never expected to procreate and produce children. Not that is until the advent of IVF treatments.

Historically, it has thus been a sterile and private occupation (and offending no one in the general population), albeit one granting some degree of ‘gratification’ with male participants using the upper and lower gastrointestinal tract. Female homosexuals achieve ‘gratification’ using the vagina but with the aid of instruments acting as a proxy penis.

The foundation of this claimed ‘right’ to be as equal as heterosexuals is therefore a self-centred one – not one based on the rights of the child or the adult obligations towards a child which in most legal precedents ‘trumps’ any adult claim.

The right to be a parent follows on from the right to be in a state – recognised union or marriage. But in the huffing and puffing of this “normalisation crusade” the financial ruin consequent upon a divorce will far outweigh any income tax benefit or inheritance tax gain

The general population while they may murmur under their breath are prepared to be tolerant of homosexual relationships to tolerate same-sex unions, however, same-sex marriage and adoption is going one and two steps too far for many.

We may come to view same sex-marriage argument as a re-run of the divorce reform of the 1970s. Twenty and even thirty years on, those ‘enlightened’ reforms are ruining the lives of millions of children and costing the state billions of pounds in social rectifications and remedies.

The speed of adopting such pro-homosexual legislation is disconcerting. When one considers how hard it has been in the past 30 years to get the barest of rights for children to see each their parent equally (shared parenting) the contrast becomes jaw dropping. One suspects that the prime movers have used their well-placed homosexual political friends to accelerate what would normally be a slow and a frequently frustrating process.

Adoption

Bitter controversy surrounds this topic and in the final analysis one has to admit that there is insufficient evidence to call it one way or the other. Nevertheless several nations are plunging headlong into this Endeavour when they don’t even allow a biological parent ( a father) to have the same sort or rights or allow him the same degree of latitude to claims of “risk”.

This is an overt case of double standards operating against all heterosexual fathers – but who cares about them ?

Figure_10_sweden
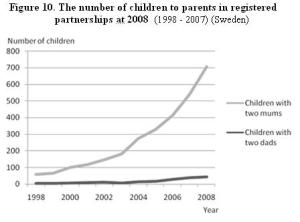
The graph here (Figure 10)shows the number of children adopted by same-sex couples in Sweden, by year.

It is interesting to note that overwhelmingly it is lesbians that feel the urge ‘to mother’, or at least look ‘normal’ to the outside world by pushing a pram and taking children to school.

What is wrong with this, one might ask ? They may be lesbians but they are essentially still female and feel their biological clock ticking away just like any other women.

What is wrong with this is that lesbian women are many times more violent than heterosexual men. Such men, when they divorce – and even when they don’t – are often accused of posing a ‘threat’ to children and their accusers are believed. They are then – often wrongly – removed from the lives of their children and yet that is precisely what lesbians and male homosexual also now want ? (see Annex 3 below).

As long ago as Jan 1999 this was an acknowledged fact with this caveat appearing on the website of Britain’s Home Office webpage (Fri Jan 22nd 1999):

  • “Domestic violence includes all kinds of physical, sexual and emotional abuse within all kinds of intimate relationships. The most harmful abuse is carried out by men against female partners, but abuse can also occur by women against men and within same-sex relationships.Home Office Web page Fri 22/1/99

The last ten years have seen the number of children living in Swedish partnership families grow tenfold. There were less than 70 children living with parents in registered partnerships at the end of the 1990s. However, by 2008 there were 749 children younger than 21 years of age living with two women or two men in registered partnerships.

Rather confusingly ’Statistics Sweden’ reports that:

  • The great majority of these children live together with two women, 706 children compared to 43 children who live with women who are registered partners. Children are common among female registered partnership families.

One has to suppose that the balance of ”43 children who live with women who are registered partners” refers to children over the age of 21. Nearly 40% of the female couples have children living at home. There is an average of 1.5 children in those partnership families with children.  Half of these children are younger than age 4.

Staying in Sweden, since May 1st  2009 All couples, regardless of sex or orientation have been  able to technically ’marry.’ Once again the majority of same-sex marriages involve women. In May 2009, 37 female couples were married compared to only 11 male couples (only weddings between persons not already/previously civilly registered as partners are included here).

When the law on registered partnership (unions) was first introduced in 1995 there were three times as many men as women who registered their partnership. Since then the number of men in partnerships has been greater than the number of women. Only time will tell what will be the trend for same-sex marriages in Sweden. [4]

Divorce

In essence fault-based divorce and custody were yesterday’s battles. The law has changed and forced fathers to change with it but why does that mean that the ‘innocent party’ still has to lose so completely ?

The double bind is that divorce, by its very definition has pitted male and female protagonists against one another in an atmosphere of public expectation and everywhere political rhetoric must be seen to uphold the guarantee of gender equality. This historic ‘gender equality’ has played itself out in the guise of court awards in favour of the ‘most vulnerable party’, invariably

seen as the mother/woman, being given the weaponry to inflict severe damage on the other ‘stronger’ party. But how will this work in same-sex scenarios ?

Until very recently custody disputes were seen as a straight-forward male/female gender equality issues. Since 2004 heterosexual men and women no longer have the monopoly of custody battles. Translated into plain English, the gender equality issue was the cause taken up by women activists to keep mothers in the driving seat and custody within their jurisdiction (and out of the hands of ordinary fathers who wanted to spend time with their children). Homosexual ‘rights’ to child adoption puts the existing an unenviable position when separation occurs. Where will the bias be seen between two of the same-sex ? (see Annex 3).

Which side of the fence will be better served by the judiciary in future custody awards, lesbian couples or homosexual couples, is still unclear. One group – or possibly both – will sooner or later become dissatisfied with the trend they see and it is at that point that the Father’s Movement (for political advantage) should consider joining with them to push for change.

Compared to its predecessor, No-Fault based divorce excludes the concept of fault and precludes any legal enquiry into guilty or gross misconduct. It is accepted by government that the usual ‘grounds for divorce’ will not be equal to heterosexual couples, e.g. for homosexuals adultery is not a ground for a divorce petition. The rationale of such a regime is that henceforth the resulting hardships of divorce should be borne equally but separately by the two parties – but not for heterosexual couples, apparently.

Hostage to fortune

In the effort to normalise their place in society homosexuals and lesbians may be jeopardising  their existing civil liberties. The whole point of cohabiting and homosexual relationships is that they are ‘under the state’s radar.’ Cohabiting for both heterosexuals and homosexuals is a private agreement reached between to adults.

Marriage, while it ‘gifts’ the state’s recognition and donates rights and privileges which cost it next to nothing since they are paid for by the taxpayer, i.e. those marrying, it also imposes punitive sanctions for any breach. Separation is a matter of exercising “free choice” just as equally as the initial joining together was a personal “free choice – but legitimising same-sex unions alters all that.

The courts are not slow to interfere in marital matters and may at times impose a social penalty or a change on people against their will. Pressing for legalised unions and marriages brings a once free section of the population under the remit of the courts and creates a new flash point. So although the intention is to give rights, privileges and benefits to homosexuals, same-sex marriage and unions may actually take away several basic rights that have been taken for granted.

Legitimately it was blackmail that was a homosexual’s greatest fear in the years before the Wolfenden Report and the Act legalising homosexual sex between adults consenting in private. Today, that fear has been replaced by being accused of coercive sexual assault and or rape of another male. In this instance homosexuals have achieved a dubious parity with heterosexuals e.g. the homosexual Deputy Speaker (2013) and heterosexual Neil Hamilton MP (2001), both  accused of rape. In the case of Neil Hamilton it was a false claim made by a sexual “fantasist.”

The right to be governed by laws that are fair are a universal ambition; opposite-sex married couples “merit” certain benefits for two reasons. First, heterosexual marriage is generally beneficial to society. Second, opposite-sex married couples incur financial risks when they have children. Marital rights, privileges and benefits are given to heterosexual married couples in consideration of their “merits” (i.e. social contributions and needs). To extend these benefits to Gays and Lesbians is an unfairness since they cannot reproduce as a couple and for them to do so incurs greater expanse and a redirection of funds away from the needs of the general population.

Equally homosexuals may well find – as have heterosexuals – that trying to defend against a false claim of rape or sexual impropriety is loaded against them and they may come to the view that the ‘el dorado of equality is in fact self-defeating.

End

ANNEX 1 – graphs & tables

Gay marriage (not unions)

Gay marriage timeline (chronology)

  1. Netherlands (2001)
  2. Belgium (2003)
  3. Spain (2005)
  4. Canada (2005)
  5. South Africa (2006)
  6. Norway (2009)
  7. Sweden (2009)
  8. Portugal (2010)
  9. Iceland (2010)
  10. Argentina (2010)
  11. Denmark (2012)
  12. Uruguay (2013)
  13. New Zealand (2013)
  14. France (2013)

 —————————————————-

Switzerland:

Total unions by sex Total_swiss

and by year

Total_Swiss_gend

Swiss_total_div

 .

.

.

.

.

————————–

Holland:

Total unions by sex Holland_table_below

and by year  Holland_long_table

.
Once again we see a divergence between official statistics. The above table shows 1,355 same-sex marriages composed of 601 homosexuals and 754 lesbians. However, the lower Table shows 1,071 homosexuals partnerships, for 2011, and 1,084 lesbians partnerships. Even if we assumed they referred to only ‘unions’ the figures still do not tally.
.

Holland_1950

.

————————————————–

Sweden:

Total unions by sex Sweden_annex

and by year

Sweden_marr

.

.

.

.Sweden_Norway

.

——————————————–

England  & Wales:

Total unions by sex UK_Total

and by year

.

.

.

Source: “Civil Partnerships Five Years On”   Population Trends No. 145 Autumn 2011 http://www.publications.parliament.uk/pa/cm201213/cmhansrd/cm130205/debtext/130205-0002.htm [Gender sum-totals for the years 2008 – 2010 have been deduced from data]. UK_2008

.

.

.

NB. There were 1,857 civil partnerships formed in England and Wales in the 11 days available in December 2005. However, there are slight discrepancies in ONS data regarding actual numbers, e.g. 2005, which shows 1,953 in one publications while in another 1,857 (see below) and also 16,106 for 2006 (see Tables below). UK_2004

UK_2005

.

.

———————————————-

Spain:

Totals by sex Spain_1a

and by year (not unions)

.

.

.

.

Spain_2

.

.

Statistical yearbook 2009  [Spain]

Spain_3

 .

.

.

.

.

.

ANNEX 2 – text & references

The first country to introduce legal recognition of same-sex unions was Denmark in 1989, and the term “registered partnership” was invented for that purpose.

Legislation in each country appears to have had influential and or homosexual politicians working behind the scenes or at least not hindering its progress. e.g. former Deputy Speaker at the House of Commons charged in May 2013 with indecent assault and rape of two males.

Denmark:

Registered partnerships (Danish: registreret partnerskab) in Denmark were created by a law enacted on 7 June 1989, the world’s first such law, and came into force on 1 October 1989.[3][4] It was extended to Greenland on 26 April 1996,[5] and later amended in 1999. Three attempts to expand the law in May 2003,[6][7][8] another in June 2003.

Same-sex marriage became legal in Denmark on 15 June 2012. The bill for legalisation, introduced by the government of Helle Thorning-Schmidt, was approved by the Folketing on 7 June 2012 and received Royal Assent on 12 June 2012

UK:

From a standing start of zero, civil unions in England & Wales mushroomed to over 16,000 in 2006. But in the following year only about half that number of civil unions were registered, i.e. 8,742.

There were 1,857 civil partnerships formed in England & Wales in the 11 days available in December 2005 and 14,943 throughout 2006. By 2010, only 5,804 civil partnerships were formed throughout the year, a large decrease since 2006.

The number of partnerships in England and Wales peaked at 4,579 in the first quarter of 2006 and remained over four thousand in the second and third quarters, but fell to 2,175 in the fourth quarter. There were 7,929 civil partnerships formed in England and Wales in 2007, a decrease of 47 per cent compared with 2006. This large decrease may reflect the fact that many same-sex couples in long-standing relationships took advantage of the opportunity to formalise their relationship in 2006, the first full year in which civil partnerships could be formed.

The number of civil partnerships decreased again in 2008 and by 2009 had fallen to 5,687 partnerships. Numbers in 2010 increased slightly by 2.1 per cent compared with 2009. This small increase may indicate that a steady level has been reached.

Civil partnership rates

Civil partnerships formed in England and Wales in December 2005 equated to an annual rate of 8.1 men per 1,000 unmarried men aged 16 and over registering a partnership, and a rate of 3.7 for women (Table 1). By 2006, the rate had decreased to 1.8 per 1,000 unmarried men and 1.0 per 1,000 unmarried women aged 16 and over. By 2010, provisional rates had fallen further and less than one person (0.5) per 1,000 unmarried adults aged 16 and over entered into a civil partnership in England and Wales.

Holland:

Dutch Radio:

‘Ten years of same-sex marriage: a mixed blessing’

Just 20% of Dutch homosexual couples are married, compared with 80% of heterosexual couples, fresh figures byStatistics Netherlands show. Between 1 April 2001 and 1 January 2011, there were a total of 14,813 same-sex marriages in the Netherlands.

The number of marriages between two women (7,522) was slightly higher than those between two men (7,291). In the same period, there were 761,010 marriages (source: Dutch Radio).

According to provisional figures from Statistics Netherlands, for the first six months, same-sex marriages made up 3.6% of the total number of marriages: a peak of around 6% in the first month followed by around 3% in the remaining months: about 2,100 men and 1,700 women in total. By June 2004, more than 6,000 same-sex marriages had been performed in the Netherlands (source: Statistics Netherlands).

In March 2006, Statistics Netherlands released estimates on the number of same-sex marriages performed in each year: 2,500 in 2001, 1,800 in 2002, 1,200 in 2004, and 1,100 in 2005 [this is not ‘Registered partnerships’]  (source:  https://en.wikipedia.org/wiki/Same-sex_marriage_in_the_Netherlands ).

“Same-sex couples in the Netherlands” and from “What is the future for ‘civil unions’ ?”  http://www.cbs.nl/NR/rdonlyres/74975167-2503-43A0-8821-66F88DA2B6B2/0/samesexcouples.pdf

According to agency statistics, 2,400 gay marriages took place in the portion of 2001 during which gay marriage was legal, with 1,800 couples following suit in 2002. That number dropped to 1,500 same-sex couples marrying in 2003, out of a total of 82,600 marriages.

Sweden:

In a survey of marriage in Sweden between 1995 and 2002, there were 1,526 gay partnerships registered compared to 280,000 heterosexual couples. Five out of every 1,000 new couples in Sweden are same-sex, and 62% of those are gay male unions.

Divorce: There is a high rate of divorce among homosexual couples in Sweden. Gay male couples were 50% more likely to divorce within eight years and lesbian couples 167% more likely to divorce than heterosexual couples. In the Netherlands, between April 2001, when gay marriage was legalized, and December 2003 there were 5,751 gay marriages and 63 divorces.

In statistics taken from couples filing cases for gay marriage in America, the couples fighting for the right to marry have been together for an average 10 years.

In a single year, 1998, the population of Sweden grew by 6,697 but by 2008 it had inflated to an annual increase of 73,420 (source: Preliminary Population Statistics, by month, 2006 – 2009 http://www.scb.se/Pages/TableAndChart____25897.aspx ).

Divorce-Risk Patterns in Same-Sex “Marriages” in Norway and Sweden, by Gunnar Andersson 1, Turid Noack 2, Ane Seierstad 2, and Harald Weedon-Fekjær  http://www.uni-koeln.de/wiso-fak/fisoz/conference/papers/p_andersson.pdf

Swedish Statistics http://www.scb.se/Pages/PressArchive____259760.aspx?PressReleaseID=276777

‘Marriage and Divorce by Country’, Isocrat.org http://isocrat.org/science/demog/mar_stats.php#madbc

Portugal:

Same-sex marriage has been legal in Portugal since 5 June 2010.[1][2] The government of Prime Minister José Sócrates introduced a bill for legalization in December 2009; it was passed by the Assembly of the Republic in February 2010.

Spain:

Same-sex marriage in Spain has been legal since 3 July 2005. In 2004, the nation’s newly elected social democratic government, led by socialist Prime Minister José Luis Rodríguez Zapatero, began a campaign for its legalisation, including the right of adoption by same-sex couples.[1] After much debate, a law permitting same-sex marriage was passed by the Cortes Generales (Spain’s bicameral parliament, composed of the Senate and the Congress of Deputies) on 30 June 2005 and published on 2 July 2005.

France:

Same-sex marriage has been legal in France since 18 May 2013.[1] It is the thirteenth country worldwide to allow same-sex couples to marry. The legislation applies to the French Overseas departments and territories.

Germany:

Since 1 August 2001, Germany has allowed registered partnerships (Eingetragene Lebenspartnerschaft) for same-sex couples. These partnerships initially provided many but not all of the rights of marriage, and currently provide all except joint adoption and full tax benefits. As of 22 October 2009, the Federal Constitutional Court of Germany has ruled that all the rights and obligations of marriage be extended to same-sex registered partners.

Switzerland:

Switzerland recognises same-sex registered partnerships. In a nationwide referendum on June 5, 2005, the Swiss people approved by 58% a registered partnership law, granting same-sex couples the same rights and protections as opposite-sex couples, except . . . .”

Annex 3

a).                Mother loses her children to former lesbian partner

 By Frances Gibb, Legal Editor The Times , April 7, 2006

 http://business.timesonline.co.uk/tol/business/law/article702829.ece

TWO young sisters were taken away from their biological mother and handed over to her former lesbian partner on the orders of the Court of Appeal yesterday.

In a landmark ruling that boosts the rights of same-sex partners, the two girls, aged 7 and 4, will now be cared for primarily by the former lesbian partner instead of their mother.

[ Question – Would you ever get two young sisters taken away from their biological mother and awarded to their biological father ? – RW ]

b).             Divorce-Risk Patterns in Same-Sex “Marriages”

in Norway and Sweden

(2004)

http://www.uni-koeln.de/wiso-fak/fisoz/conference/papers/p_andersson.pdf

 Exctract:

4. The populations of registered partners in Norway and Sweden

Our first observation is that the incidence of same-sex marriage in Norway and Sweden is not particularly impressive in terms of numbers. Our data for Norway consist of 1,293 partnerships contracted 1993-20019. During the same calendar period, 190,000 heterosexual marriages were entered, which gives a ratio of around 7 new same-sex marriages to every 1,000 new opposite-sex marriages.

For Sweden our data comprise 1,526 partnerships entered 1995-20029. Related to the corresponding 280,000 heterosexual marriages registered during the same calendar period, we get a ratio of 5 new partnerships to every 1000 new opposite-sex marriages.

The ratios of partnerships to marriages are thus considerably lower than the various estimates of fractions of homosexuals that we referred to in Section 2. The incidence of partnership formation in the two countries also appears relatively low when compared to the levels of partnership formation in Denmark and the Netherlands (Waaldijk 2001: 463; Noack et al. 2002: Figure 1; Eggen 2002: 229; Digoix et al. 2004).

Trends in partnership formation by country and sex (Figure 1) reveal that the developments in annual numbers of new partnerships have been quite similar in the two countries. Both countries exhibited a particularly high level of partnership formation immediately after the legislation on registered partnerships came into force . . . . .”

c).                   Predicting the number of civil partnerships

by Robert Whiston, Fri, 23/10/2009 – 12:29

http://www.straightstatistics.org/article/predicting-number-civil-partnerships

Guesstimate

d).                                Messy Lesbian divorces

 By Glenn Sacks, MA Executive Director, Fathers & Families & Ned Holstein, M.D., M.S.Founder, Chairman of the Board, Fathers & Families  glenn@glennsacks.com

 See also the rise of lesbian custody Battles

(http://glennsacks.com/blog/?p=4311 )

20th  October 2009

Ned Holstein, MD and I co-authored a new piece for MSN.com on lesbian child custody battles. Regardless of whether one supports or opposes gay marriage, lesbian custody battles are enormously illustrative of the dynamics behind heterosexual family court battles.

Mothers are often able to convince courts to allow them to drive decent, loving fathers out of their children’s lives by employing anti-father/pro-mother stereotypes and by portraying dads as abusive or unfit. But there are no abusive males or bad dads in lesbian custody battles. Nevertheless, when two lesbians agree to have a child together and the relationship goes sour, the lesbian biological mom often does the exact same thing to her ex as heterosexual mothers do.

Certainly there are abusive fathers from whom mothers need protection in family court, but when a mother decides to drive a father out of his kids’ lives, abuse or unfitness isn’t usually the motivation.

The column is With Gay Marriage Comes Gay Divorce: The Rise of Lesbian Custody Battles (MSN.com, 10/15/09). We wrote:

  • It’s not every day that America’s conservative Christians rally around the cause of a lesbian. Yet numerous groups are providing support and expensive legal services for Lisa Miller. Miller’s cause? To deny her former civil union partner Janet Jenkins any role in the life of the daughter they raised together.Miller and Jenkins joined in a same-sex civil union in Vermont in 2000 as Lisa Miller-Jenkins and Janet Miller-Jenkins, and had a child named Isabella Miller-Jenkins together in 2002. Lisa was artificially inseminated from a sperm donor who they chose because his physical traits closely matched Janet’s, who became Isabella’s social mother. According to the Washington Post:”When Isabella was born, Janet had the honor of cutting the umbilical cord … Lisa and Janet had researched how best to bond with the baby … [at night] ‘Every two or three hours, Isabella would wake up so Lisa could nurse her,’ Janet said. ‘I would take Isabella from that point. I would burp her … I would rock her. She would go back to sleep on my heartbeat’ … Janet’s parents were enthralled, and embraced Isabella as their newest grandchild.”In 2004 Miller decided to leave Jenkins and move to Virginia, agreeing to a liberal parenting time schedule for Jenkins, who paid child support to Miller. Yet after Miller got to Virginia, she violated the agreement, deciding that she wanted sole custody of Isabella and excluding Jenkins from the child’s life. The Liberty Counsel, a close partner of the late Rev. Jerry Falwell’s Liberty University, has spearheaded Miller’s legal case.Jenkins, who has helped care for children at day care centers in two states, treasures pictures she has of Isabella helping her in their garden, picking through her purse and playing with wooden trains. “These are hard to look at … we were happy,” she says. She remembers how Isabella would say “Uppy” when she wanted Janet to pick her up.Miller, who became a Christian and renounced lesbianism after leaving Jenkins, even pushed aside Jenkins’ parents, who Isabella adores and who live near Miller. Janet’s dad Bucky, a retired firefighter who’s been married to his wife Ruth for over 50 years, says, “The loser in the whole thing, of course, was the baby.”Vermont judges have seen the dispute Jenkins’ way throughout the case. On Aug. 25 a Vermont court found Miller in contempt, imposing a fine on Miller if she continues to violate Jenkins’ court-ordered visitation.Miller could have been incarcerated by the court but Jenkins — showing Miller a kindness both unreciprocated and unmerited — told the court she didn’t want Miller jailed. What she wants is to see her daughter. Afterwards, Miller declared that she’s going to continue her legal battle to keep Isabella away from Jenkins “because that’s what a Christian is supposed to do.”Miller is, of course, entitled to choose her own sexuality and religion. But she chose to have a child with Jenkins and shouldn’t be able to obliterate this because it doesn’t fit in with her new beliefs. And however one feels about gay marriage, it is enormously damaging to children to have one of the two people they love the most in the world — a parent — ripped out of their lives. The saddest part is that children usually blame themselves, asking, “What did I do to make mom not want to be with me anymore?”Lesbian custody battles are now becoming routine, and dozens of them have been the subject of hotly contested cases in recent years. Some of the biological mothers are so determined to drive the social mothers out of their children’s lives that they even invoke laws which limit gays’ parental rights as a way to win their cases.LGBT (lesbian, gay, bisexual and transgender) activists believe courts haven’t adequately protected the rights of lesbian social mothers because of the tenuous legal status of gay marriages and relationships, and they’re partly correct. But much of the problem lies in the way courts treat noncustodial parents, regardless of sexual orientation. Most of Miller’s tactics are well known to noncustodial fathers…

Read the full column at:   With Gay Marriage Comes Gay Divorce:The Rise of Lesbian Custody Battles (MSN.com, 10/15/09).

e).                                           Another closet

by Adam Dawson, The Guardian, Monday Jan. 8th 2007

Violence in same-sex relationships often goes unmentioned – and is increasingly common, writes Adam Dawson
http://society.guardian.co.uk/socialcare/comment/0,,1982005,00.html

Research carried out by Prof Hester shows that the victims of abuse within same-sex relationships are more likely to go to friends for help than women who suffer abuse at the hands of male partners, who are more likely to report the incident to the police.

Regardless of the sex or sexual orientation of the perpetrator, domestic abuse revolves around power rather than physical strength.
Victims often say that the psychological and emotional abuse outweighs the physical abuse, which stays with a person for longer than the scars of physical abuse.

Chris Lyle, from the School of Health at Wolverhampton University, said: “The traditional focus of men as perpetrators and women as victims has dominated academic debate and development of policy to the detriment of a wider understanding of violence within other forms of intimate relationships. It also means that current resources for victims are aimed at straight women which prevent gay men and women receiving help and support.”

The research carried out by Prof Hester and her team shows that domestic violence is a huge problem in same sex relationships and that men are more likely to experience abuse from their partner.
Some behaviour such as rape may go unreported because of victims’ difficulty in naming their experience

f).      ‘News, Same-sex ‘marriage’ has negative effects, shows latest  evidence’

https://www.spuc.org.uk/news/releases/2013/march02

by Dr. Patricia Morgan (March 2013)

London, 2 March 2013: The experience of legalising marriage for same-sex couples in Europe and North America shows that such legalisation has negative effects for real marriage and for families, shows latest evidence.

The evidence was presented to the House of Commons committee examining the Marriage (Same Sex Couples) Bill, in a written submission by Dr Patricia Morgan, the British family policy researcher, on behalf of the Society for the Protection of Unborn Children (SPUC) www.spuc.org.uk The submission can be read in full at www.spuc.org.uk/campaigns/ssmsub20130301

Based on research and data from Sweden, Norway, Denmark, the Netherlands, Spain, Canada and the US, Dr Morgan concluded that:

  • as marriage is redefined to accommodate same-sex couples, this reinforces the idea that marriage is irrelevant to parenthood
  • same-sex marriage leads to the casualisation of heterosexual unions and separation of marriage and parenthood
  • Spain saw a pronounced acceleration in the decline of marriage following the introduction of same-sex marriage (same-sex marriage was introduced at the same time as the ‘express divorce bill’)
  • across all countries analysed, no causal link has been established to support the idea that same-sex marriage prevents marital decline
  • in the move to same-sex marriage, opposite-sex relationships have to conform to gay norms rather than vice-versa
  • a publicly-professed, legal, partnership does not prevent homosexual couples from breaking up more frequently than married heterosexual couples
  • experience with same-sex partnerships/marriage legislation tends to suggest that availability is all, and participation more or less irrelevant to sexual minorities
  • same-sex marriage may be the end-game of long-running anti-marriage, anti-family policy typified by Sweden
  • same-sex marriage may begin the process of severing marriage from family in otherwise family-friendly societies such as Spain and the Netherlands
  • same-sex marriage triggers dismemberment of family structures in family-friendly societies.

As a pro-life organisation, SPUC campaigns against same-sex marriage because:

  1. marriage – the permanent, exclusive union of one man and one woman – is the basis of the family, the fundamental group unit of society. Upholding marriage is therefore in everyone’s interests.
  2. marriage as an institution protects children, both born and unborn. Statistics show that unborn children are much safer within marriage than outside marriage.
  3. same-sex marriage lacks basic elements of true marriage e.g. the complementary sexual difference between spouses necessary for the procreation and healthy upbringing of children.
  4. same-sex marriage represents an attempt to redefine marriage, thus undermining marriage. This undermining lessens the protection for unborn children which true marriage provides.

SPUC is working with the Coalition for Marriage (C4M) to oppose the British government’s plans to legalise same-sex marriage. SPUC published a position paper on same-sex marriage following a resolution by SPUC’s Council. SPUC has also made available a background paper to be read in conjunction with the position paper and which provides some additional references and reflections.

g).               Human Fertilisation and Embryology Bill (H of L)

 http://www.publications.parliament.uk/pa/ld200708/ldhansrd/text/71119-0004.htm

 [NB.  Ruth Deech, was one of the architects of the divorce reform chaos of 1969 – RW ]

 19 Nov 2007 : Column 674

However, I feel that I should take issue with two clauses. Clause 14 would omit a child’s need for a father as a consideration in the assessment of welfare that has to be carried out by the doctor proposing to treat a woman. I hope that this new clause can be removed so that we revert to the law as it stands—the careful and sensitive compromise worked out in 1990, as described by the noble and learned Lord, Lord Mackay, which has held firm for all that period. The requirement is, after all, only to consider the need; it is not an absolute ban on treatment by any means, and it is well known that many single women and gay couples receive IVF treatment at clinics and have children. The argument for removing it is that it is now public policy to treat all families equally and to avoid any discrimination between persons on grounds of gender and sexual orientation and because there are inconsistencies and unknowns in the way that the provision is applied. There is no need for a father, it is said, especially given that there is provision in the current Bill for two women to be the legal parents of a child.

Does a child really not need a father? Clearly, the need for a mother remains unchallenged—it is implicit in the way that the law works. I think that a child needs a father. First, we are where we are. To remove the requirement that a child needs a father is to make a fresh statement to the effect that a child does not need a father. It sends a message to men, at a time when many of them feel undermined as providers and parents, contrary to government policy in this field. Government policy is that men should pay for their children after divorce and separation and that they should take responsibility. Divorce law judges hold that contact with a father after divorce is a good thing. Recently, the Government have sought to encourage single women to name the father of their babies on the birth certificates. We are told that children who find out that they are adopted or created by donor insemination need to know their fathers. The United Nations Convention on the Rights of the Child says that every child has the right to know and to be cared for by both parents and of course anonymity has been removed from sperm donors, which must mean that they are important.

There is a wealth of research showing that children need fathers, not just a parent. Children need to see complementary roles, the relationship between the sexes, a microcosm of society as they grow up. There is also research showing that children born to lesbian parents do well, but it is limited research, mostly carried out by one researcher in this country and of necessity the children are very young. Some research shows that those children suffer from the inevitably confused and secretive family relationships that occur.

Recent reports have placed Britainat the bottom of the international league tables for the welfare of children and we know that boys without parents fail at school, that they turn to worse role models and that fathers play a great part in the upbringing of their children as well. A survey reported this morning shows that 77 per cent of the public would keep the law the way it is. After all, if a woman is pregnant and her husband dies during the pregnancy, do we not say that is a tragedy?

h).                                                        Same sex parents

“Adopting the parent trap”

Legalization the adoption of children by Homosexual parents.

Sydney Morning Herald, May 7th  2003

The issue of gay adoption in Tasmania has rekindled debate on  whether or not children need a female and a male parent, writes Bettina Arndt.

 Extract

http://www.smh.com.au/articles/2003/05/06/1051987702147.html?oneclick=true

“. . . . American researchers Robert Lerner and Althea Nagai, experts in the field of quantitative analysis, evaluated 49 studies on homosexual parenting – studies often used to “prove” that a child is not adversely affected by gay parenting. All 49 studies were found to have at least one major flaw.

Lerner and Nagai, who published their 2001 analysis in a paper entitled ‘No Basis: What the Studies Don’t Tell Us about Same-Sex Parenting’, conclude: “The methods used … are so flawed that these studies prove nothing … the studies on which such claims are based are all gravely deficient …Therefore they should not be used in legal cases to make any arguments about homosexual versus heterosexual parenting.”

This conclusion was shared by Professor Lyn Wardle, who criticised the same-sex parenting research in a 1997 article in the University of Illinois Law Review. After examining the use of this research in US legal cases, Wardle argues that until concerns about the current  “badly flawed” research are dispelled, “*it would not be rational to adopt a public policy endorsing or legitimating homosexual  parenting*”.

Last year [2002] a British sociologist, Dr. Patricia Morgan, weighed in with her own analysis, ‘Children as Trophies – Examining the Evidence on Same-Sex Parenting’. Morgan criticises the research for often including only very young children, which precludes any possibility of picking up long-term effects. She says many of the children spend their formative years in heterosexual families before the homosexual family is formed, which makes findings difficult to interpret.

The few studies which track children to adulthood are also flawed, according to Morgan. She criticises Fiona Tasker and Susan Golombok’s work published in ‘Growing Up in a Lesbian Family’ for comparing children of lesbian women who have PhDs with those of poorly educated lone parents and for downplaying negative effects such as teasing by peers.

Morgan says is it is astonishing that “gushing personal testimonies” by lesbian parents should be “reverentially accepted by public bodies, academics and research institutes who would immediately laugh away the use of similar materials as evidence elsewhere”….

Sarantakos’s research, which compared 58 children of same-sex couples with the same number in matched heterosexual families, found  a far higher proportion of children in the same-sex families

identified themselves as homosexual or were labelled as such by their parents. He found that result unsurprising because the gay family provides both factors likely to provide the genesis for    homosexuality – environment plus genetic make-up.

See “Children as Trophies – Examining the Evidence on Same-Sex Parenting”.   By Patricia Morgan, http://www.amazon.co.uk/exec/obidos/ASIN/1901086186/wwwlink-software-21/026-2359530-3083610

E N D

References:

  1. http://www.pbs.org/newshour/bb/law/gay_marriage/unions.html
  2. http://www.statistics.gov.uk/downloads/theme_population/PopTrends137web.pdf
  3. http://www.rnw.nl/english/article/ten-years-same-sex-marriage-a-mixed-blessing
  4. https://www.spuc.org.uk/news/releases/2013/march02
  5. https://en.wikipedia.org/wiki/Same-sex_marriage_in_the_Netherlands
  6.  http://www.cbs.nl/NR/rdonlyres/74975167-2503-43A0-8821-66F88DA2B6B2/0/samesexcouples.pdf
  7. http://www.loveandpride.com/informationcenter/tips.aspx?categoryid=5
  8. http://www.scb.se/Pages/PressArchive____259760.aspx?PressReleaseID=276777
  9. http://www.publications.parliament.uk/pa/cm201213/cmpublic/marriage/memo/m94.htm http://www.straightstatistics.org/article/predicting-number-civil-partnerships

Footnotes:

[1] See http://www.expatica.com/nl/life-in-netherlands/lifestyle/Same-sex-marriage-some-facts-and-figures_12249.html

[2] Ref. Statistics Sweden, Karin Lundström http://www.scb.se/Pages/PressRelease____352125.aspx and Information om statistikens kvalitet, framställningssätt samt tabeller och diagram m.m.

[3] For example  http://www.taeterinnen.org/en/02_impact.html  and “Same-Sex Unions and Divorce Risk: Data From Sweden” http://www.marriagedebate.com/pdf/SSdivorcerisk.pdf (2004).

[4] Ref. Statistics Sweden, Karin Lundström http://www.scb.se/Pages/PressRelease____352125.aspx  and Information om statistikens kvalitet, framställningssätt samt tabeller och diagram m.m.

Death in the West

Demographic Transition: a future death course where children are only optional extras

by Robert Whiston FRSA 27th May 2013

Birth rate collapse has almost  invariably  been the hallmark, the precursor, of the death of a civilistion. Where specific value orientations collide with the spirit of the age, we have  Weltsanschauung vs. Zeitgeist.

Forget the economic recession.

Ignore the messy money markets.

Reject rumours of a second impending financial catastrophe as mere detail – there is a far bigger fish.

In fact there’s a whale of problem yet to sink our teeth into and it’s called ‘demographic transition.’[1]

It has implications that are deeper and will last longer than any transient economic set-back. Even greenhouse gases and global warming are being elbowed out-of-the-way demographic transition.

Our society, in fact the entire advanced western world, is in transition – and it’s not a good transition if the experts are to be believed. The money markets will sort themselves out one day and either huge losses or profits will be made equally the economic recession will slowly lift. But even if all this happened next week the West would still be facing a destiny of decay and decline.

Globalisation

The problem we have caused ourselves is not greenhouse gases or global warming but our birth rate. Put at is simplest the world as we know it has moved from “high birth rates and high death rates” to low birth and low death rates.

As countries develop from a pre-industrial to an industrialised economic system and then into a post-industrial era social norms and expectations alter with them. These changes can be demonstrated using a demographic transition model.[2]

Some years ago, circa 1990s,  it was decided that “globalisation” would be a good thing for everyone. It is a process whereby products are manufactured in off-shore countries and imported into the home market and sold by well known domestic brands, e.g. Apple computers, i-phones etc. This increases world-wide exchanges of national know-how, trade secrets and these days intellectual property especially in electronics. The result is that the once held competitive edges are lost to other manufacturers.

In 2000, the International Monetary Fund (IMF) identified four basic aspects of globalization as being: trade and transactions, movements of capital and investment, movement of people (migration) and the dissemination of knowledge.

Moving manufacturing and service support industries overseas to a secondary market boost employment and wages there, e.g. India, China,  but leaves thousands in the original or primary markets jobless and unemployable (the US and the West). These jobless and unemployable individuals are then expected to use their savings and good credits rating to buy goods (they once made) from made overseas. What happens when families and individual credits ratings collapse is misery and poverty of the sort we have not seen since the 19th century.

The only benefit is a short to medium term one, where owners and shareholders see an increased return on their investment but then as the Samsung Android legal battle has shown, aggressively enforcing technical compliance has cost Apple millions in legal fees which robs shareholders of their full yield (Apple is facing more than 10 law suits in over 10 countries).

Globalisation is only a culturally positive resources when it cuts down on the need for worldwide transportation which it does not. It best achieves this ambition by utilising the global telecommunications infrastructure of which the Internet is a significant part. It also achieves this ambition by spreading intangibles such as knowledge and generating further inter-dependence economic and cultural activities that do not adversely affect standards of living.

The current scenarios is far worse then the ‘recession’ and ‘the slump’ of the 1920s and 1930s simply because techniques used then worked after several years and, so far, no progress has yet been made since 2008. The race to the bottom in terms of a currency war as seen in the 1930s isn’t happening / working because all Central Banks are issuing billions of dollars in QE (quantitative easing).

No free lunch

The problem monopolies, large industries and governments have given themselves (and us), is how to maintain the expected standards of living in the West while fertility rates are falling but the total population is increasing and with unemployment soaring.

Fundamentally, do we want to live longer lives and have fewer babies die because if we do, then there is an economic penalty to pay. Do we want to maintain our standard of living because if we do we cannot afford to be doing some of the things we are doing now and which we take for granted.

In the 21st century we are ladened down not only 1/. a world economic recession, 2/. dubious paper currencies, but the many ill effects of 3/. globalization, topped of by the nightmares of 4/. Demographic Transition.

Demographic Transition

Demographic transition (DT) refers to the transition from “high birth and death rates” to “low birth and death rates” as a country moves from pre-industrial to industrialised.

Stages_1_5At the end of the 19th century several French scholars noted that a remarkable change was taking place in the population of their country. The number of children per family was declining and clearly, they thought, this was as the result of deliberate efforts to reduce fertility within marriage by seen or unseen forces.

 It soon came to be understood that the voluntary limitation of marital fertility was a revolutionary novelty and to reflect this the term ‘demographic revolution’ was the original term used to describe it.

It was appreciated by those in the field  that the decline in fertility was an adjustment (conscious or unconscious) triggered by the decline in neo-natal, peri-natal and infant mortality.

The world’s most advanced economic powers are currently at Stage 4 as shown on the graph (right), with ‘total population’ increasing but with both the birth and death rate slumping.

Square one

To better understand how the process works we have to start at Stage 1 and work through the various Stages.

In Stage 1, we are looking at a pre-industrial society, where death rates and birth rates are high and roughly in balance. But you will notice that the ‘total population’ is surprisingly small.

All human populations (civilisations) are believed to have had this balance until the late 18th century, when this balance began to end in Western Europe. This was the epoch of epic world navigation, chronometers, and the creation of trading empires, e.g. Britain and Holland.

By the time Stage 2 is reached developing countries display a rapidly falling death rates due to the improvements in farming methods, (e.g. crop rotation, selective breeding etc ), food supply, and sanitation (sewerage), which increase life spans and reduces disease.

A characteristic of Stage 2 is the change in the age structure of the population. In Stage 1, the majority of deaths are concentrated in the first 5 – Age_pyramid10 years of life. The decline in child death rates in Stage 2, therefore, entailsa growing population with a profile shown here (left). With a population increasingly youthful these ‘children’ then soon enter their reproductive cycle and thus maintain the high fertility rates of their parents.

In these societies marriage is usually at an earlier age, say, between 16 and 21. in the developed world of Stage 4 and 5 marriage is now deferred to approx. 30 years of age.

A side-effect of the bottom of the “age pyramid” becoming so wide is that it accelerates population growth. The age structure of such a population is illustrated by using an example from the Third World today (see Tiger economies below).

In Stage 3 birth rates fall due to emerging access to contraception, increases in wages, urbanisation, a reduction in subsistence agriculture, a reduction in the value of children’s work, an increase in parental investment in the education of children and other social changes. Population growth is seem top continue upwards but is rate of increase begins to level off. The birth rate decline in developed countries first started in the late 19th century in northern Europe.

In the bitter Politically Correct culture in which we now have to live, another item is included which is of doubtful merit, namely, “an increase in the status and education of women.” This has to be suspect given that in the 19th century education for the working masses, though it included females, ended at the age of 14 and was premised on providing the basics. Any increase in the status of women is either in the eye of the beholder (wishful thinking), or limited to the upper 5% of women in society.

Convention did not allow Upper Class women to work and Middle Class women took their cue from their betters with only a few jobs seen as “respectable.” It was the un-respectable female working class that had to go out to work performing all manner of jobs

During Stage 4 there are both low birth rates and low death rates. Birth rates may drop to well below replacement level as has happened in countries like Germany, Italy, and Japan – and now the USA,  France, Italy, Spain and the UK to name but a few. This leads to a shrinking population which threatens many industries which have relied on population growth for their workforce.

As the large group born during Stage 2 becomes older and enters retirement, they represent, by Stage 4, a disproportionate number of the Total Population.

This  creates an economic burden on a shrinking working population and has been the source of much pension reform discussion in the UK several years ago (see “Immigration Deceit – Part 2https://motoristmatters.wordpress.com/2012/09/27/35/  and “Anders Breivik: Europe’s dreams crash in flameshttps://motoristmatters.wordpress.com/2011/09/06/29/ and “Turning a blind eye to the birth rate” (Dec 2010) http://www.straightstatistics.org/article/turning-blind-eye-birth-rate ).

Political fix

Long before the financial banking collapse of 2008 the anxiety was for pensions. Throughout the 2000s it was pensions and how they could be afforded that was on top of the political agenda. In the UK a government committee headed by Adair Turner published its last and doom-laden report in 2006. Forecast  for benefit entitlement were not being properly funded by pension plans – private firms with private pension plans began to find them unaffordable, and in the public/state sector pensions were even more wildly out of kilter.

The matter of how many pensioners there were (and thus the cost of the state’s universal basic pension) compared to the numbers of young people working and paying taxes and thereby funding state pension scheme came under the microscope as never before.

For the first time in living memory the Media fanned the flames of inter-generational prejudice, forgetting thatthe burden of the old, as they saw it, had produced and paid for the lifestyle choices and standard of living the young generation saw as a right and took for granted.

Tiger economies

Malthus once famously predicted over-population would lead to an inability to feed society. [3] However while the West struggles with low birth rates and poor economic performance those countries adjacent to the Indian Ocean and South Pacific have expanding populations driving up consumer demand.

Unlike the West, as the population group born during Stage 2 ages, it is countered by the economic activity and enterprise of the recently born generation maturing in adulthood. [4]

10,000In our own age we have seen these countries leap from Stage 2 to Stage 3 as their industrial base becomes established. China is perhaps the sole exception to the rule with it one-baby-policy yet booming economy.

As remarked above, French scholars of the 19th century who first noted demographic changes in Europe. They believed it was deliberate efforts to reduce fertility within marriage that reduced the number of children per family. Later in the 20th century this work was taken up by American demographer Warren Thompson (1887–1973). Thompson observed the same changes (or transitions), in birth and death rates in industrialised societies spanning the previous 200 years. Most developed countries he found were at Stage 4 of the model with the majority of ‘developing countries’ at Stage 3.

Both Thompson and his French predecessors concluded that this ‘adjustment’ in fertility was a necessary one, prompted by better child survival rate (mortality). This would imply a “human-swarm” phenomenon at work. Families in S.E. Asia are still comparatively large though, as of 2010, in the Philippines for example they are slowly reducing in size.

It also directly tells observers that, without reference to any higher being or authority, the old or long-term demographic balance had become redundant and a new balance had to be established as a working replacement. This applies equally to France in the 19th century as it does to present day Taiwan or Philippines. A decline in old age mortality, an increase in child survival plus a decline in fertility results in unsustainable levels of high natural population growth.

Is it simply a coincidence that industrialised countries also have the highest rate of divorce ? Is it simply a coincidence that in industrialised countries wealth inheritance has been directly interfered with – even perverted – by divorces courts having the power to re-allocate property and wealth away from its owner ?

This is not to say that Tiger economies nations will remain at their present equilibrium due to the “Doppler effect” which will probably, at some time in the future, see them follow in the footsteps of the West.

Doppler effect

We are all familiar with the peculiar sound of a fast approaching train and how sounds differently as it reaches us and then moves away from us – a similar thing is seen in child birth numbers.

When women delay childbearing to later in life, the number of births observed in a particular year is distorted downward. Conversely, when women bear children at a younger age, the births numbers pile up and in he process distort fertility statistics upward.

An apparent inflation of birth numbers was observed during the “baby boom” of the 1950s in the United States and arguable a little earlier (circa 1947), in Britain after World War II.

Quasi-equilibrium

Although we speak in concrete terms of Stage 1 and Stage 2 etc they are, in actuality, moveable feast and there is constant fluidity. Fertility rates and death numbers can alter because they are only semi-permanent features which are forever evolving and altering.

John Bongaarts is a leading population researcher and of its impact on social structures [5]  He has written extensively on this subject and promotes an appealing  assumption  that society moves from one long-term quasi-equilibrium to another (ref. paper 2001:260):

  • ‘If fertility in contemporary post-transitional societies had indeed leveled off at or near the replacement level, there would have been limited interest in the subject because this would have been expected.’
  • ‘However, fertility has dropped below the replacement level sometimes by a substantial margin in virtually every population that has moved through the demographic transition. If future fertility remains at these low levels, population will decline in size and age rapidly.’

This last sentence addresses the pensions time bomb outlined above. Bongaarts’ belief is that while there may be an element of ‘postponement’ of births there is the real prospect that it becomes a permanent lifestyle choice.

If and when couples appear to lack the motivation to have more than one or two children two of the several things that will flow are: 1/. migration and 2/. immigration.

An unsettled society

Newtonian Law teaches us that “for every action there is an equal and opposite reaction” and in this case it appears to be migration and immigration.

Multiple ‘disequilibrium events’ will then occur in relatively rapid succession. Firstly, there will be the disequilibrium of postponed births leading to a new demographic imbalance.

Secondly, there will be another disequilibrium as the migration of elements of the younger generation depart for other shores. And thirdly, there will be yet another disequilibrium as the immigration numbers increase.

Whereas indigenous migrant leaving Britain will be single, childless couples or couples with few children the immigrant cohort will be single, or childless couples, or couples with many children. Even those singles and couples which are initially childless will have larger than average numbers of children.

Political dynamics

The above scenario might explain why under New Labour immigration was not only undertaken quietly but on a vast scale. When it was eventually advertised it was as something economically good for the country – the downside was that it would literally and metaphorically change the complexion of Britain. It could be argued that as governments in the West realised they had no control over fertility rates this was an obvious solution.

The graph below (Demographic change, Sweden 1735 – 2000), describes the fall in both crude death rate (CDR), the crude birth rate (CBR) [6] At Stage 4 they overlap indicating its moribund state. Since 1975 its population numbers have lacked life, vitality, dynamism and vigour.                 sweden_1701Swedish migration to the New World was, relative to its size, on an epic scale during the 19th century and driven not by the affluence we see today but by it’s poverty. The New World needed immigrants to populate its vast empty territories and expand its economy when Europe, at the time, could not support them. [7] It was therefore mutually beneficial to both the old and new world. The tacit understanding was that the migration would be permanent.

Swedish migration peaked  in the years between 1870 and 1900. By 1890 the U.S. census reported a Swedish-American population of nearly 800,000. The graph above begins to show a serious decline in CBR and CDR beginning in years around 1875 – having held almost stable prior to that. About 1.3 million Swedes left for the United States though some put it as 1.8 million.

The effect of this mass immigration between 1846 and 1932 – mainly from Eastern Europe – into the US and Canada (but also Latin America, and Oceania), was to reset the quasi-equilibrium, i.e. that of fertility and death rates.

The westward immigration, totalling around 50 million, served as a ‘safety valve’ to release some of the pressure on resources caused by far too rapid population growth in the continental Europe.[8]

Sweden awakes

Six days of riots in Sweden (beginning May 24th 2013), have sharpened even the stoic Swedes attitude towards their liberal immigration policy. Sweden has about 1.8 million immigrants of its total population of 9.5 million (just over 14% – but some would put it at 19%). And the problem is not just numbers, it is the imported culture and inheritance.

Sweden has taken in more than 11,000 refugees from Syria since 2012;  it has absorbed Kosovan. and over the over the past two decades absorbed more than 100,000 Iraqis and 40,000 Somalis. None of these ethnic groupings can be said to have a democratic heritage or work other than on tribal lines. Yet they are thrust by government into one of the most laid-back but rigorous democracies in Europe where expectations of compliance with civic order and pride are high.

burn_outIt has come as a shock for many Swedes to discover the scale of resentment found in the ghettos that have sprung up.

Right: Stockholm, Sweden,  aftermath of May 2013

Denmark, Norway and indeed Sweden itself are not new to riots or ethnic unrest (see https://motoristmatters.wordpress.com/2011/09/06/29/). Some of these latest immigrants to Sweden can be said to be not only ‘economic migrant’ in the bad old usage of the phrase but also now ‘choosy economics tourist migrants’. For example, Mohammed Hassan, a Bangladeshi, now studying in Husby, previously lived in Brick Lane in East London. His comment to the Guardian is revealing: [9]

  • “It’s much, much better than any other European country in which I’ve travelled.”

‘Deferred gratification’ and the ‘Protestant work ethic’ are unknowns to these ethnic groups. While it can be said that both are not be fully adopted by all of Europe’s modern generation they are still potent totems and forces to be reckoned with.

Poignantly, the media has disclosed that one-third of the 2,500 white, ethnic Swedes who lived in Husky 10 years ago have left. Milos. A resident complains that:

  • “My children say: ‘Why don’t you leave there? All the Swedish have gone.’ There’s only three Swedish families left in this whole block.
  • These people, they should integrate in this society and just try a little bit more to be like Swedish citizens.”

Evolution of DT

Originally it was thought that changes ascribed to DT were linked to ‘the moral order’, e.g. Leroy-Beaulieu (1896), but towards the end of the Second World War, and thereafter, it was American scholars who took the lead in the subjects discussion. As a result explanations became more based on economics. However Notestein (1945), who played a crucial part in the formulation also stressed the overriding importance of mortality decline. He foresaw the impact of the modernisation process on people’s lives and in society as a whole and concluded that DT was likely to be a universal phenomenon which all countries were bound to pass through it once they had achieved a degree of industrialisation. The implication was that all would lose their long-held moral values.

In the 19th century the consensus was that climbing the social ladder would be handicapped by having a large family – and in many instances this is true. Dumont postulated that the result would be a low birth rate, and a low the birth rate would lead to increased social mobility.

This was certainly the aftershock of the Black Death which arguable was the spur for capitalism as it killed-off feudalism.[10]  The Bubonic Plague suddenly put a ‘premium’ on healthy able-bodied servants (the serfs). Entire families who owned the land and farms died and with no one to till the land serfs took over and set-up in business. Serfs (working people) suddenly found they had a cash value and wages and prices were negotiated in the way they are today

20th Century DT

In Western Europe labour shortages in a number of industrial sectors occurred during the 1960s. These were resolved through the recruitment, in the case of Germany, of “guest workers”, mainly from Southern Europe, Turkey, and Morocco. In the case of Britain and slightly earlier, in the late 1950s, worker shortages were made up from Commonwealth immigrants, principally the West Indies.

Policy makers of the time had envisaged ‘guest workers’ had not come to stay permanently but a contrary view was held by the immigrants. They were moving to countries where great wealth could be generated. Without fully realising it, the legacy of Word War II and countries who were signatories of UN Conventions became duty-bound to more liberal policies regarding the opening of their borders.

Through nepotism, tribalism and the host country’s liberalist practice of ‘family reunification’ a steady stream of immigrants joined those migrants already in the host country. Thus concentrations of one clan / religion began building in certain specific geographical areas.

Immigration became even more of a determinant of population growth when, from the early 1990s onward, the number of applicants for political asylum rose to unprecedented high levels.

Many countries have had to take steps to curb their number but it has to be admitted all have had limited success. Illegal migration has gained ground in importance as a consequence (and unhelpfully) polarised political debate.

The common consensus during the boom of the late 20th century was that, like it or not, advanced industrialised countries would continue to attract of immigration because of the “better life” prospects. Sometimes this immigration would be unwanted and or unwelcomed.

To make this trend more politically palatable ‘net migration’ data (off-setting immigration with emigration) would be used wherever possible. Net migration in industrialised countries of the world would consequently show only a fairly modest positive inflow. Pubic concern over the total numbers could be distracted by targeting 1/ recognized refugees, 2/. tourists over-staying their visa, 3/. asylum seekers, 4/. undocumented migrants brought in through trafficking, 5/. seasonal labourers and 6/. economic migrants.

Stage 5

Some commentators believe the industrialised world has now passed into a new stage, namely, stage 5 –  and some believe we might even be in Stage 6.

The Second Demographic Transition, as it is called, was launched as a concept in 1986. It recognised that all industrialised countries had reached a new stage in their demographic development – one characterised by couples having full control over their own fertility.

Stages 1 to 4 all had scenarios where the fertility rate though low was recoverable. Stages 5 + and or the Second Demographic Transition may see the fertility rate becoming non-recoverable by the indigenous population. Both more-fertile and less-fertile futures have been claimed as a feature of Stage 5.

The 2nd Demographic Transition

The essential difference between the First and the Second demographic transitions would be that the former was predominantly a long-term consequence of the decline in mortality. The Second Transition should be viewed as the consequence of fertility declining way below the levels long thought viable for nationhood. The role of marriage, cohabitation and divorce are all critical to his new wave or Second Demographic Transition.

First_demog

Humans are not always rationale beings though they may always strive to be just that. Battered by materialism and consumerism deep flaws are emerging without us realising it .This quote by Philippe Ariès [11] sums up the predicament we are sleepwalking into:

  • ‘The ways people look at life usually are determined by more mysterious, more indirect causes, I feel that a profound, hidden, but intense relationship exists between the long-term pattern of the birth rate and attitudes towards the child. The decline in the birth rate that began at the end of the eighteenth century and continued until the 1930s was unleashed by an enormous sentimental and financial investment in the child. I see the current decrease in the birth rate as being, on the contrary, provoked by exactly the opposite attitude. The days of the child-king are over. The under-forty generation is leading us into a new epoch, one in which the child, to say the least, occupies a smaller place.

If noting else the above expresses an absolute minimum suggesting an important and clearly distinct phase in the classical transition  compared with life today. In presenting his views, Ariès refers to observations made by Alfred Sauvy whom he knew quite well.

Sauvy reportedly stated thatthe important new phenomenon involved in the renewed decline of fertility was that people refused to have an undesired child.

  • “If carelessness or an accident results in a pregnancy … this triggers a violent rejection reaction; an abortion is sought” (op. cit.: 130).

Emerging slowly in the mid-1960s  the subject in the life plans of married couples and individuals is that  the child is not so much absent but more of an item or commodity to be fitted into their lives as just ‘one of the various components that make it possible for adults to blossom as individuals ’(loc. cit.). Being aspirational must mean accepting that there is only one life and that is the ‘here and now.’ Maximising one’s career chances and artistic talents therefore take a priority never before seen. Who would willing want to shared the glow of affording luxury goods and the lifestyle following in the wake of these choices ?

Self-liberation, contraceptives and medically safe abortion are the bedrock that make this series of choices possible. Sexual congress between heterosexuals in this environment then becomes recreational as never before and mimics that more casual sexual behaviour of homosexuals.

This also underscores a possible loss of religious values (the procreation of children) and why marriage is no optional for many couples. if true the Second Demographic Transition is epitomized by the loss of  ‘altruistic’ motives and the rise of ‘individualistic’ ones. (Van de Kaa, 1987:5). [12]

Mediterranean countries where the institution of marriage once was on negotiable now appears to be changing rapidly as it earlier did in France. The impact of the Second Demographic Transition is universal and ubiquitous to Roman Catholic countries, for examples Spain, Portugal and Slovenia where once extra-marital births were 8.5 % in 1970 they were 35.4 % in 1999.

Conclusion

When Van de Kaa & Lesthaeghe devised the concept of a Second Demographic Transition in 2001, they believed it could be compared to a “cyclone irresistibly sweeping south from Scandinavia and gradually engulfing the South of Europe before turning East and, most probably, to other parts of the developed world.” It was a metaphor that has proven to be more true than they could have imagined at the time. Empirical evidence shows that at any point in time each country or region has its own demographic heritage and cultural endowment and yet it is constantly in flux. How well these countries react to the dispersion of events that change the status quo depends in part on how well new ideas can be incorporated into existing patterns and traditions.

But it is clear that the random dispersal of events and the adjustments they induce are compounded by the economic turmoil presently being encountered.

E N D


[1] The Autor is aware that a whale is not technically a fish.

[3] “The power of population is indefinitely greater than the power in the earth to produce subsistence for man”. Robert Malthus FRS (1766 – 1834).

[4] Shrinking working population; “The Idea of a Second Demographic Transition in Industrialized Countries” http://www.ipss.go.jp/webj-ad/webjournal.files/population/2003_4/kaa.pdf

[5] Vice president of “Policy Research Division at the Population Council” New York, and known for his statistical analyses.

[7] One of the main enticements was the availability of low-cost, high quality farm land, e.g. in the upper Midwest (the area from Illinois to Montana).

[9] “Swedish riots spark surprise and anger” http://www.guardian.co.uk/world/2013/may/25/sweden-europe-news

[10] It devastated Europe in the years between 1348 and 1350, killing between 75 million and 200 million people (est’d).

[11] IUSSP-seminar “Two successive motivations for the declining of the birth rate in the West.” 1980

[12] The Idea of a Second Demographic Transition in Industrialized Countries. Paper presented at the Sixth Welfare Policy Seminar of the National Institute of Population and Social Security, Tokyo, Japan, 29 January 2002 Dirk J. van de Kaa

Married but for all the wrong reasons.

by Robert Whiston May 8th 2913

Tim Loughton’s speech in Feb 2013 when the “Marriage [Same Sex Couples] Bill” was being debated summed up the contradictions at the heart of the new legislation. In 2004, he readily accepts, that he along with a great number of other MPs voted enthusiastically for the “Civil Partnership Bill” – promoted as it was at the time as “giving full equality in the eyes of the law for people in same-sex relationships.” So why the need now for a same-sex marriage Act ?

Indeed, the Official Report (House of Lords, 12 May 2004; Vol. 661, c.  GC179), plainly states:

  • “I want to put our position very clearly. This is a new legal status that gives rights and responsibilities to people in same-sex committed relationships… We do not see it as analogous to marriage. We do not see it as a drift towards gay marriage.”

After all it never appeared in any of the 3 major political party’s 2010 Election Manifestos ! Not even as an aspiration ! The absurdity does not stop there – with divorce on grounds of adultery and failure to  consummate being unavailable, how can this be called marriage ?

A poll sponsored by the Daily Mail found that only ‘1 in 14’ (or 7%), of those questioned thought that same-sex marriage should be given a priority. Another poll found that more than 60% of the black and minority ethnic communities – the very people that the Tory party wants to woo – were hostile to it.

With this in mind perhaps now is a good time to see how the 2004 Act is working out in practice. Is it, as Tim Loughton MP believes, not a lack of equality in the law but a lack of equality in the eyes of  people,  i.e. society at large ? If so then simply adding an extra flourish or changing the name of the ceremony will not address the problem.[ref. http://www.publications.parliament.uk/pa/cm201213/cmhansrd/cm130205/debtext/130205-0002.htm ].

Gay ‘marriage’ numbers take nose dive !

The opinion held by some is that the homosexual lobby only wanted parity with heterosexuals for political purposes appears to be coming true. The number of ‘civil partnerships’ is not climbing as anticipated but falling steadily.

Through their strenuous efforts to appear as ‘normal’ as everyone else the gay and lesbian fraternity sought to have the status of marriage conferred upon them. This proved a political bridge too far in 2003 – 04 but by 2013 it is now a done deal along with the right to adopt children.

The spine to the present 2013 gay marriage argument is that homosexuals have ‘humans rights’ which are not being fulfilled because they cannot marry or adopt children – but they seems content that they cannot (within their normality) conceive and give birth. This also overlooks the very real fact that many young heterosexual (and homosexual) women conceive and give birth outside of wedlock and yet they make no special pleadings.

The reasons given on the first occasion (Civil Partnerships) were many and varied but high among them was that 1). they wanted nothing more than ‘next of kin’ status so they had the right to visit their ill or dying partner in hospital, 2). that they could not be evicted on the death of their partner and 3). that they could enjoy the same deferred death tax liability as a heterosexual spousal couple.

In the lead up to the vote those politicians in favour of a reform for homosexuals stated that 10% or more, (20%) of the UK population was homosexual – this was quite untrue but it went unchallenged.

This last reason / excuse was in fact a hidden tax advantage since neither of the same-sex partners could divorce and so neither would lose the majority of their wealth in any separation. Most if not all the reason given to homo_1legalise ‘civil partnerships’ were spurious since they could all have been dealt with under the existing law – even the eviction and inheritance tax claims – given a little thought.

From another quadrant, at the time, come the opinion that civil  partnerships’ would probably be short-lived affairs either because having gained that political goal it would prove a launch pad for full equality with heterosexual marriage or that civil partnerships’ would be inherently unstable anyway.

homo_2Those who thought homosexual civil partnerships would be short-lived affairs probably based their opinions on the observed promiscuous lifestyle that homosexual indulged in when compared with heterosexuals.

Five years on and there is now sufficient data to assess the situation afresh and examine what if any prophecies and hypotheses were on target. From the graphic shown here we can ascertain that after the initial publicity and razzle-dazzle causing a burst of interest, numbers rapidly became flaccid, falling from 9,000 in 2006 and 6.000 to a level of 3,000 for both sexes by 2010. [1]

See also “Predicting the number of civil partnerships”  Straight Statistics, Oct 2009, http://webcache.googleusercontent.com/search?q=cache:ayCbb8YAnnIJ:www.straightstatistics.org/article/predicting-number-civil-partnerships+&cd=4&hl=en&ct=clnk&gl=uk

Figures for Dec 2005 could fairly be subsumed by the 2006 data giving a total of over 10,000 male same-sex partnerships and 8,000 female ones.

homo_2a

Initially males unions out-numbered female one but by 2009 there was almost parity between them.

The bleak outlook created by the yearly decrease in numbers of civil partner-ships being formed is reinforced by the escalation in civil partnerships being dissolved.

What is a civil partnership ?

In Dec 2005 same-sex couples could first form and register their ‘partnership’.

A civil partnership is formed when one party gives notice in writing of their intention to form a civil partnership and the second civil partner then signs the relevant documents.

This is unlike a civil marriage for heterosexuals which is formed when the couple exchange spoken words.

Straight v Gay divorces

Comparing the differences in civil partnership dissolutions with divorces is illuminating. Partners dissolving a civil partnership are typically younger than brides and grooms when they divorce, despite the average age at marriage being lower than that at civil partnership.

In 2007 the mean age at civil partnership dissolution in England and Wales was 40.5 years for men and 39.4 years for women but by 2010 it had fallen to 39.5 years for men and 37.7 years for women.

This compares to a mean age for heterosexual divorce in 2009 (the latest year for which data are available) of 44.0 years for men and 41.5 years for women.

Calculating actual numbers

Cohabitation has always posed a problems for ‘bean counters’ at the ONS as the rapidity of partner exchange means they are a “flow variable” and no a “stock variable” as in the case of longer lasting marriages.

Calculating just an estimate of the ‘stock’ of civil partners from the small number registered and from survey sources results in diverging numbers.

To calculate an estimate for a ‘stock variable’ of civil partners requires the following:

homo_3ONS reports that the estimate for the number of civil partners living in England & Wales is consistently lower when using registration data than when using surveys (except in 2010 where the LFS and registration data are similar).

To give an example, in 2009 the estimated stock of civil partners from registration data was 68,000, whereas it was 78,000 according to the LFS (Labour Force Survey) and 88,000 according to the APS (Annual Population Survey).

How rock solid ?

Comparison are difficult when there might be 240,000 marriages in a given year and only 15,000 same-sex registered partnerships.

homo_4By ‘year four’, i.e. circa 2009, 5.5% (or about 13,000) of the marriages created in 2005

had been dissolved (Incidentally, four years is usually not long enough for the couples to have started a family).

This seemingly compares well with only 2.5% of civil partnerships (CP) that were comparably entered into that year but were dissolved by year four, i.e. 2009

homo_5What one has to consider is whether if there were only 1,857 heterosexual marriage in 2005, would the subsequent divorce rate be higher or lower than 2.5% ? One suspects – given historic data and other trends – that it would be much lower and that if there were 247,805 civil partnerships (CP) the rate would be far in excess of 5.5% after 4 years. 

Murdoch legacy

Much, if not all of the reform introduced to accommodate homosexual wishes, were premised on the assumption – indeed, the claim – that homosexuals and lesbians comprised 10% of  the  British population. The left leaning newspaper, the  ‘Observer’, repeated the 20%  figure promoted by Stonewall’s Ben Summerskill. [2]  Politicians were for several decades under the psychological cosh of the powerful national newspapers that were able to set agendas and massage reactions (as demonstrated in May 2012 by the launch of the Leveson Inquiry).

Analyse for a moment the PC madness of that era (1995 – 1999), which arguably still exists to this day. It was not just the much beloved  judicial allegory of the“Man on the Clapham Omnibus” but MPs who knew that to avoid the accusation of bigotry/prejudice adulation of buggery, sodomy and other perversions had to be embraced as necessary features in “a more liberal society.”[3]

Although deep down the Man on the Clapham Omnibus or MPs might view such things as distasteful if not perversions he is told to hold them in check. However, he is then told that paedophilia is a horrid and abhorrent act and so he is rightly confused.

A head of steam for reform had already been built up by the end of 1999 by activists such as Peter Tatchel. A bewildering variety of figures were cited by protagonists including “over 10%.”  A monthly journal, “The Ill Eagle” (Aug 2000, ISSN 1466-9005) cited the only known dependable/ empirical source as “Sexual Behaviour in Britain” by K  Wellington et al. (Penguin, 1994, p 183). Their 1992 study of 8,337 British men found that 6.1% have had a “homosexual experience” and 3.6% had “1+ homosexual partner. This was sharply discounted by Stonewall and  the Gay lobby as a gross underestimate.

Homosexuality was a topic hardly discussed and so the true extent of it was virtually unknown. Dr. Alfred Kinsey’s infamous books “Sexual Behavior in the Human Male” (pub’d 1948) and “Sexual Behavior in the Human Female” (pub’d 1953) had been exercises in disinformation. Kinsey concluded that between ‘1 in 3’ and ‘1 to 5’ of the population were wholly or occasionally homosexual. He served only to muddy the waters.

Into this vacuum came the Treasury and the Department of Trade and Industry survey at the beginning of 2005 to help the Government analyse the financial implications of the Civil Partnerships Act (such as pensions, inheritance and tax benefits).

Coinciding with the Dec 2005 legal reforms the Treasury and the Department of Trade and Industry published the results of their survey which appeared to show that government believed “3.6 million  people in Britain were gay.” It was clear that the ulterior motives were economic – if tax concession were to be given to Gays then what did they contribute to the economy ? There then flowed much media discussion  relating to ‘Chasing the pink pound’ and  ‘companies trying to grab a slice of the £60bn gay economy,’ etc. [4]

Public acceptance ?

By 2010, having gained significant advances the Gay lobby wanted to push open still further the door by moving on to having ‘the right’ to adopt children and formally marry, like heterosexuals.

The Office for National Statistics (ONS) became involved in homosexuals numbers in 2010 and collected data. They found that only 1.5% of the population considered themselves gay or lesbian  (480,000 or 1% male or female homosexuals, plus 245,000, i.e.  0.5% bisexual).[5]  NB. A further 0.5% self-identified as “other”, and 3% responded as “do not know” or refused to answer.

  • “Almost three-quarters of a million UK adults say they are gay, lesbian or bisexual – equivalent to 1.5% of the population, a survey suggests. The Office for National Statistics (ONS) says 480,000 (1%) consider themselves gay or lesbian, and 245,000 (0.5%) bisexual.”

This is a far cry from the claims of 20% made in 1999 and again as recently as 2005.

Casting our minds back to the much beloved  judicial allegory of the “Man on the Clapham Omnibus”, mentioned above, and the perplexing situation his modern equivalent now faces, the ONS survey (Civil Partnerships Five Years On) tried to measure shifting public attitudes. 

In matters of social change it is often the young who are more receptive to new ideas and a shift in morals. So in many ways the legitimising of Gay marriage is a re-run of the arguments heard during the divorce reforms of 1969 and abortion-for-all battle.

The ‘young turks’ closest to the levers of power  wanted change, almost at any price, while the older generation were either not so sure or hostile. It is a matter of public record that ‘young turks’ such as the young Ruth Deech underestimated the awful impact the divorce reforms they were helping to shape would have on the generale public. [6]

It is a well-known fact that abortions have been seriously high but a lesser known fact is that the introduction of abortions have cut the replacement birth rate. Were all the abortions to be converted into ‘live births’, the ratio of children in families in britain would not be lower than replacement level at 1.9 (or 1.7) but a healthy 2.4 children per average family.

homo_6For many decades during the  20th century homosexuality was seen as repulsive, a sexual deviant behaviour pattern, and even sinful. Some religions still hold all of those views, e.g. Catholics, Mohammedans, etc. 

The repulsion was not aided by the emergence of AIDS and HIV among the homosexual community in the 1980s and their lifestyle became a target. [7] 

The graphic here shows the slow ‘acceptance of homosexual  realtions’ but not, one suspects, the lifestyle or practices which still remains repugnant to homo_7those questioned.

The trend line graph above shows the “cross over date” – at about 45% – where those who thought it always wrong and those who responded that it was rarely wrong to be circa 2001. By any stretch of the imagination this is a significant shift.

However there is a trend among younger people to be more tolerant – but this could reflect social conditioning more than a moral or social judgement.

Although this bar graph represents men’s sentiments the comparable for women shows the same sort of age divide regarding acceptance or disapproval.

One only has to look at the slump in the perceived ‘acceptance’ expressed by age group to see that “strongly approve” at 15% for young people almost disappears at 2% for those age 70 or over.

Those strongly approving “laws that treat same-sex partnership somewhat like marriage” are in the age category least likely to know what marriage entails. Conversely, those thatstrongly disapprove increase as the age group asked gets older, and arguably wiser.

homo_8

Aggregating the combined  total percentage of those that either disapproved or strongly disapproved, the older age group (50 -69 and 70+) disapprove at a  26.5% level compared with the two younger groups  ((18- 29) and 20-49) who disapproved at only 10.5%.

International view

The graph above shows the apparent acceptance of homosexuality by each country. This should this be seen as a validation of homosexuality but more the acknowledgement that they have a right to lead their lives within society at large. Opponents of the same-sex movement point to the possibility of an involvement of  a dominating Commisariat within both the UN and EU at supra-state levels.

Mental illness

Freud recognised and categorised same-sex love and attraction as a ‘deviancy’.  Homosexuality in the modern era (19 th century onwards), was diagnosed and treated as a psychiatric illness – an abnormal behaviour – until 1973, when due to intense political pressure and lobbying it was removed from the Diagnostic and Statistical Manual of Mental Disorders (DSM) used world-wide in psychiatry 

But even before that time (19 th century), homosexuality as viewed by the unscientific pubic as odd even depraved behavior (ref; Bible, Koran, Shakespeare, statute law, 20th century novel / fiction).

Mental health consequences are overlooked in all the publicly aired debates, past and present. The relationship between being predisposed to homosexuality and suffering depression and or enacting suicide (six times the general population), is treated as if it were a state secret. [8]

Almost three times as many homosexuals  are likely to suffer from generalised anxiety disorder than the general population. Homosexuals are overrepresented in the drug addiction/dependency section of society and are said to be many time more predisposed (five times) to smoking  than non-homosexuals.

Dr. Fitzgibbons who is the source for these particular figures has not surprisingly come under criticism from homosexuals. This is to be expected when the stakes for further progress are so high for the homosexuals lobby which often refers to itself as LGBT ( Lesbian, Gay, Bisexual and Transgender – or transsexual).

When the “personal is the political” this challenging of sound data has to be expected, however, Dr. Fitzgibbons is a principal contributor to the Catholic Medical Association’s statement on “Homosexuality and Hope” and so can be relied upon to know more than most about the subject.

But this points-up a valid problem. Not enough research has been undertaken of an empirical and superlative nature. Consequently each report that points to the pluses and minus of a homosexual lifestyle is taken to pieces either because of it small sample size or methodology.

No public health warning

Take for instance life expectancy, i.e. mortality. Cigarettes have had to carry a health warning because they are said to shorten life and induce chronic diseases. But there is no such health warning for homosexuality.

Apart from the AIDS and HIV scare, the homosexual lifestyle carries no warning to the young. It can be argued that the case for determining homosexual lifestyle as ‘injurious to health’ has yet to be dully firmed up but the same argument applies to cigarettes where only a linkage – but not a cause or sole  cause – has been established. (See Sir Richard Doll:  “The risk of developing the disease [lung cancer] increases . . . .” For instance, the case for the asbestos industry, or the nickel & coal-tar workers’ cancer is far more clear cut.

Figures from the Family Research Institute, appear to show that ‘sexually active’ homosexual males had an average life expectancy of about 42 years – and this was before the advent of AIDS – with only 1%  living past age 65. [9]

The problem with figures from the Colorado based ‘Family Research Institute’ is that they collected their  information from the obituaries in homosexual periodicals which were usually urban based. Thy claim they collected “tens of thousands of gay obituaries” (2005). Compared with CDC mortality figures  life expectancy for homosexuals is about twenty years shorter than that of the general public. [10]

This might be sound for some purposed  it is not random or spread enough. A study published in 1994 with the rather melodramatic title of “Omega Journal of Death and Dying” used the same biased technique (this concluded that gay men have an average lifespan of 43 years). These obituaries were mostly AIDS-related and with the decline of AIDS as a killer, the death rate can be expected to re-adjust. American homosexual groups see Dr. Paul Cameron, the founder of the  Family Research Institute as a hate figure and the Institute as a hate group. How true this is, is pure conjecture.

Canadian Parliamentarians were presented in 2005 with scientific evidence by a group of physicians into the health risks of homosexual marriage. [11]  Canada’sparialment was warned:

  • “the new law will result in the further normalization of homosexual sex which has already resulted in severe health risks and related costs to care for and treat persons affected by risky sexual behaviour.”

The document, signed by doctors in different disciplines from family medicine, dermatology and neurology, warns that anal sex as practiced by most gay men, has a large number of diseases associated with it, “many of which are rare or even unknown in the heterosexual population” such as: anal cancer, Chlamydia trachomatis, Cryptosporidium, Giardia lamblia, Herpes simplex virus, HIV, Human papilloma virus, Isospora belli, Microsporidia, Gonorrhoea, Syphilis, Hepatitis B and C and others.

The same medical experts noted that:

  •  “Over 70% of all AIDS diagnoses in Canada in adults over the age of 15 up to June 2004 were in homosexual men (13,019 out of 19,238). . .. . . .“Any attempts to legalise gay marriage should be aware of the link between homosexuality and pedophilia”

This last issue, paedophilia, is even more contentious than the live expectancy battle – and one can why it is so important for both sides because it is the last barrier to having the right to adopt children like normal heterosexual couples.

Both sides of the argument accept that the majority of homosexuals are not involved in pedophilia, however it remains a concern because a disproportionately greater number of homosexuals have  more paedophilian inclinations than in the general population.

The Journal of Homosexuality has demonstrated an overlap between the homosexual activist movement and the promoters of paedophilia. it is this ‘overlap’ between the gay movement and the movement by some activists to make pedophilia more acceptable.” 

The journal references studies showing that “. . . . .while the number of homosexuals in essentially all surveys is less than 3% . … . .  the percentage of homosexuals among pedophiles is 25%.” It concludes:

  • “Therefore, the prevalence of pedophilia among homosexuals is about 10 – 25 times higher than one would expect if the proportion of pedophiles were evenly distributed within the (hetero- and homosexual) populations.”  [12]

 One of the earliest references to be found linking homosexuals to paedophilia is by Dr T Stammers (quoting  Kurt Freund 1989). In the Autumn 1997, FYC bulletin he wrote referring to the 2% of the population thought to be homosexual  that “ . . . 35% of paedophiles are drawn from that 2%.”[13]

This is seen by homosexuals as an especially pernicious belief and understandably so. For their part they claim that:

  • A number of researchers have looked at this question to determine if homosexuals are more likely to be pedophiles than heterosexuals, and the data indicate that’s not the case.

Centre of the storm

The trigger for all of the controversy mentioned above and for much more (enough to fill a double-decker bus), was a 2001 paper published in the International Journal of Epidemiology by Robert Hogg (based at the ‘British Columbia Centre for Excellence in HIV/AIDS’). [14] The paper was a study of the gay and bisexual life expectancy in Vancouver in the late 1980s and early 1990s. Due to its pivotal dateline it received so much abuse and misuse that the authors were obliged to complain that their work was being used for non-scientific purposes ie political gain. notwithstanding this the paper demonstrated that in a major Canadian centre, life expectancy at age 20 years for gay and bisexual men was 8 to 21 years less than for all men, i.e. heterosexual.

  • “If the same pattern of mortality continued, we estimated that nearly half of gay and bisexual men currently aged 20 years would not reach their 65th birthday.”
  • “Deaths from HIV infection have declined dramatically in this population since 1996. As we have previously reported there has been a threefold decrease in mortality in Vancouver as well as in other parts of British Columbia.”

This, of course, assumes that HIV is the same as AIDS, whereby HIV is predominantly a chronic and treatable illness and AIDS is usually a terminal illness.

Gridlocked

Who today can remember that when AIDS was first discovered it was called “Gay Related Immune Deficiency” (GRID) ? Initially, the HIV virus quickly spread among the highly promiscuous male homosexuals. Inevitably, bisexuals introduced it to promiscuous heterosexuals and it went mainstream. Pressure over the name escalated until Acquired Immune Deficiency Syndrome (AIDS) became more generally accepted, masking the initial source of infection and the obvious connection to the “gay” community.

“And the band played on”

Re-awakening another forgotten memory, is the non-fiction book “And the Band Played On” of 1987 by Randy Shilts, a San Francisco Chronicle journalist. He chronicled the discovery and spread of Human Immunodeficiency Virus (HIV) and Acquired Immune Deficiency Syndrome (AIDS). To understand how it spread so rapidly one has to understand the sexual practices of the gay bath houses which non-gays will find astounding.

Shilts specially emphasises the government indifference and the political in-fighting especially in the United States to what was then perceived as a specifically gay disease. Reporting AIDS also proved difficult with many papers refusing to publish .

The book, “And the Band Played On: Politics, People, and the AIDS Epidemicbegins with the first known AIDS case in the late 1970s, that of Margrethe Rask, a Danish doctor working in Africa and end with the announcement by actor Rock Hudson in 1985 that he was dying of AIDS, which  caused an explosion of interest in the disease.

Miss Rask was – and this is only coincidental – a lesbian and she was cared for by her partner until her death in Denmark in Nov 1977. But what is interesting is the subsequent worldwide race to identify the virus and find a cure . Rask’s blood samples were assayed in Copenhagen in 1984 –  a period of extensive global research into AIDS – using the Enzyme-linked immunosorbent assay (ELISA) technique. It was an early version of an ELISA test and it tested negative for HIV/AIDS. Later, in 1987, the samples were re-tested with a more advanced ELISA test and both tested positive.

But there is some brighter news – though it is only a report and can be said to have no depth to it until it is verified by other findings.

Gay mortality – good news

Denmark was the first EU state to authorise/legalise same-sex marriages and from there come good news for homosexual couples in particular life expectancy for gays. Since the advent of same-sex marriage, a new study finds, the death rates (mortality) has dropped among married gay men and women.[15]

This mimics other studies that have shown a link between  health and marriage for heterosexual (opposite-sex) couples.

Men in same-sex couples now have lower mortality rates than unmarried or divorced men. Only men in heterosexual opposite-sex marriages live longer than the other 3 categories.

Researcher Martin Frisch, of the Statens Serum Institute in Copenhagen and the Center for Sexology Research of Aalborg University, said of the study:

  • “Among men in Denmark, it is more dangerous to be unmarried or divorced than to be married to another man,”

The Statens Serum Institute found that:

  • Female widows and divorcees were about 1.4 and 1.6 times more likely to die during the study period than those who were married to a man.
  • And mortality rates for unmarried women rose slightly between 1982 and 2011, from 1.5 to 1.7 times more likely to die than married women.
  • Men who were divorced also saw their chance of mortality go up over the study period, from 1.3 to 1.7 times more likely to die than married men
  • Male widowers were 1.4 times more likely to die than men in opposite-sex marriages as of 2011, a slight increase from 1.2 in 1982
  • For unmarried men, the same numbers rose from 1.2 to 1.7 between 1982 and 2011.

Flash in the pan ?

Almost 4 years ago  and based on experience abroad, for instance, in Scandinavia and Holland,  attempts were made  to predict a possible trend for same-sex unions (marriages) in the UK. See http://www.straightstatistics.org/article/predicting-number-civil-partnerships dated Fri, 23/10/2009.

The prediction was that it would stabilise at a figure which would  reflect the smallness of the  minority that homosexuals actually represented in society (at the time there were estimates of 10% to 20% ref. Stonewall’s Ben Summerskill et al),  and the media of the time failed to seek verification  of the claim.

Guesstimate

Above is the graph produced in 2009 forecasting what was though to be the future trend of a continued collapse followed by a leveling off at a much reduced figure.

Now that the numbers are available we can calculate the outcome. Assuming that there are a total of 6,000 civil partnership ceremonies pa (3,000 male plus 3,000 female), and assuming that the UK population is 60 million then the number of those taking advantage of the 2005 legislation is a mere 0.01%

If we take the Treasury’s study figure of 480,000 (1%) who say they consider themselves gay or lesbian, then the arithmetic becomes 1.25% (480,000 = / 6,000 =  1.25%).

Leaving aside the question of whether all the fuss was justified for only a 1% of usage among the  designated sub-set or one hundredth of one percent among the generals population, when the legislation was introduced some critics said that it would diminish the status of marriage and make it less likely that heterosexual couples would marry.

The Swedish data on heterosexual marriage rates, however, seems to contradict this. But caution and even skepticism is required when ever politic statistics and ideology find themselves sharing the same bed,

 E N D

 
Footnotes:


[1] See “Civil Partnerships Five Years On”   Population Trends No. 145 Autumn 2011.

[2] “3.6 million  people in Britain are gay – official. First Whitehall figure settles long-running debate” Sunday 11 Dec 2005 http://www.guardian.co.uk/uk/2005/dec/11/gayrights.immigrationpolicy  Chasing the pink pound: companies trying to grab a slice of the £60bn gay economy

[3] “The Ill Eagle”, Aug 2000, ISSN 1466-9005, referencing Melanie Phillips, Sunday Times, 30 July 2000

[5] Sept. 23rd 2010, http://www.bbc.co.uk/news/uk-11398629

[6] “Divorce Dissent”, Ruth Deech, 1995.

[7]  “AIDS and HIV risk”. Nature 360 (6403): 410–2. doi:10.1038/360410a0. PMID.

[8] ‘Physician Says Science of Medical Consequences of Homosexual Behaviour is Being Trumped by Political Agenda’ by LifeSiteNews.com, Sat Sep 20, 2003  http://www.lifesitenews.com/news/archive//ldn/2003/sep/03092008 

[9] The Dark Side of ‘Gay’ Issue Date: July/August 2012 http://www.chick.com/bc/2012/darkside.asp

[10] See also Psychological Reports (2005;96:693-697).

[11] Same-Sex ‘Marriage’ a Health Risk Doctors Warn Parliamentarians, by Lifesitwe news.com FEB 17, 2005 HTTP://WWW.LIFESITENEWS.COM/NEWS/ARCHIVE//LDN/2005/FEB/05021709

[12] The authors of the report are John Shea,MD, FRCP (C), Radiologist; John K. Wilson MD, FRCP (C), Cardiologist; Paul Ranalli MD, FRCP (C), Neurologist; Christina Paulaitis MD, CCFP, Family Physician; Luigi Castagna

[13] In Kurt Freund’s  1989 study at the Clarke Institute of Psychiatry in Canada, scientists showed pictures of children to adult gay and straight males, and measured sexual arousal. Homosexual men reacted no more strongly to pictures of male children than heterosexual men reacted to pictures of female children.

[14] St Paul’s Hospital, University of British Columbia, Vancouver, Canada. http://ije.oxfordjournals.org/content/30/6/1499.full   

[15] “Same-Sex Marriage Linked to Longer Lives”, by Stephanie Pappas, ‘LiveScience’ Senior Writer, 11th  March 2013 http://www.livescience.com/27796-same-sex-marriage-mortality-rates.html  

Abu Qatada and divorce – some parallels ! !

by Robert Whiston    April 27th 2013  

Abu Qatada, alleged terrorist, said to be al Qaida’s spiritual leader in Europe and the most significant extremist preacher in the UK is rated as ”a truly dangerous individual”.   The media is presently all agog with the evil of this character currently on our shores

He arrived in Britain in 1992 having fled to Pakistan from his native Jordan in 1989 and ever since then a variety of governments and a veritable succession of Home Secretaries have tried to deport him.

Abu-terrorAbu Qatada has been described as Osama bin Laden’s right-hand man in Europe and the continent’s spiritual leader of al Qaida.

Left: Abu Qatada and what is thought to be his wife out shopping

Yet forsaking all the Saudi petro-dollars that back al Qaida’s in all its theatres of war Abu Qatada is happy to make the British tax payer fund his legal defence – and this is where the similarity with divorce crashes in.

Abu Qatada was born in Bethlehem in the West Bank and his real name is Omar Mahmoud. He was sentenced in absentia to life imprisonment with hard labour for conspiracy to carry out terror attacks. [1]

The real name of divorce is wealth and property confiscation and these days it has precious little to do with simply dissolving a union. A divorce sentence can also be likened to financial life imprisonment for former husbands. Whether this is with the prospect of ‘parole’ or attenuated in some other way, is dependent on the country involved.

Britain has put Abu Qatada on trial over and over again. His prosecution, quite rightly, has been paid for by government money raised from general taxation. But his defence team has also been paid for by money raised from the hard pressed tax-payer through “legal aid.”

So we have a situation where the Home Office perverts the adage ‘Robbing Peter to pay Paul’ into “Robbing the taxpayer to pay both Peter and Paul.

The same could be said of divorce; the state (Paul) pays the courts, through legal aid funded by the tax-payer) to rob former spouses, usually the husband, who has to repay not just his wife’s legal aid (i.e. Peter) but his own legal fees plus court costs and thus back to the state, Paul. The only loser in all this would appear to be the husband.

Abu Qatada has been fighting extradition for 10 years and many a divorce and some custody cases can last almost as long. As of 2012 he has cost the taxpayer in legal aid bills an estimated £515,778 but, says Teresa May in the House of Commons (April 2013), one should not always believe what one Teresa_Mayreads in the press (but then government sources in the mid 1990s put the cost of single motherhood on the taxpayer at no more than £1 billion when it was actually in excess of £11 billion pa.

Every minister in her position clings onto the ‘rule of law’ mantra and the need to ‘uphold international commitments’ as both a shield and riposte to defend the situation.

Significantly, Teresa May has the money and the to   time to ride out appeals after appeal in order to obtain final justice. Husbands usually don’t have such deep pockets if their ex-wife threatens to take matters to the next judicial level and husbands invariably are unable to take their own case to the next level of appeal to seek justice. Thus, a fudged compromise is reached where the choice is a “take or leave it” offer.

Another ‘dangerous’ fugitive wanted by a foreign power was Astrid Proll, an escaped member of the Baader-Meinhof gang (aka Red Army Faction), who illegally entered Britain on a false passport. She then married Robin Astrid_prolPuttick and became a British citizen and “acquired domicile in England.” [2]

Left: Astrid Proll, pictured outside a London police station soon after her arrest

In the days before the Human Rights Act, she was arrested in 1978 by Special Branch. The seemingly impossible situation of deporting a British citizen was resolved by the unprecedented revoking of her British passport and nationality. The grounds being a fraudulent and invalid passport and that she was a fugitive from foreign justice.  She was then able to be extradited to Germany. Sir George Baker P cited Dicey & Morrs:

  • “It has been held that a domicile of choice cannot be acquired by illegal residence. The reason for this rule is that a court cannot allow a person to acquire a domicile in defiance of the law which that court itself administers.”

 Are there any pointers here for Mrs. May MP ?

Abu Qatada is living in London with his wife and five children aged seven to 18. Is there any expectation that they will deported from their semi-detached house when he is ? Very little one would think  given past experience and then we have the prospect of them living off welfare benefits.

Justice denied

There is a legal maxim which states “Justice delayed is justice denied”. Many Home Office ministers – and Teresa May, in April 2013, is no exception – have vented their frustration at being forced to jump through successive legal hoops and suffer delay after delay.

Many husbands would share Teresa May’s feelings when their cases for divorce and or custody is delayed time and again. However, Teresa May’s can remain relatively detached safe in the knowledge that the rule of law is paramount and due process will be applied and is therefore worth the delay.

Unfortunately, this does not hold true for husbands going through a divorce. They find “due  process” evaporates as soon as the doors to the secret hearing close. They also find that the rule of law is far from paramount with the selective application of sections 25 to 27 of the Matrimonial Proceedings Act 1973.

  • The key statutory provision is section 25 of the Matrimonial Proceedings Act 1973 which  sets out the matters to which the court is to have regard when exercising its powers. The court has a duty “to have regard to all the circumstances of the case”, but its first consideration must be for the welfare of any child of the family under 18. The statute  then lists a number of matters to which the court should pay particular regard. They are not listed in order of priority; different factors may be particularly influential in different cases (but can include continuing financial claims, an order allocating their property [section 25A]), depending upon their facts. 

However, these considerations are “More honoured in the breach than in the observance.”

The net effect is to not only drive down the numbers marrying but thatlegal aid, originally intended to allow ‘the poor’ in society access to justice is being squandered by terrorists, foreigners and divorcées.

Appeals abuse

In February 2001, Abu Qatada was arrested and questioned in connection with a German terrorist cell. At the time there was insufficient evidence against him, and all charges were dropped.  However, tapes of his sermons were later discovered in a Hamburg flat which had been used by the 9/11 hijackers.

After a series of court appearances the UK Court of Appeal, in 2008, ruled against the British government when it concluded that Abu Qatada conviction for terrorism in Jordan (in 1999), was based on evidence extracted through torture.

Tier upon tier

The April lament from Teresa May, the Home Secretary, is that there is layer after layer of court where appeals can be made to delay deportation plus there are the Immigration Tribunals and Commissioners and the Special Immigration Appeals Commission (SIAC). Cases can get taken before the Law Lords (now the Supreme Court) and thence to Europe where cases can become buried for several years.

This is undoubtedly true but it is a regime wholly under the control (or absence thereof) of the Home Office and as such has “grow’d like Topsy.”

To break through this impasse Britain’s Home Secretary says she has struck a “fair trial” deal with Jordan – one that would exclude evidence gained from torture. Divorce ‘trials’ in the UK need the same “fair trial” deal to guarantee perjury will not be tolerated and that impunity no longer exists for false allegations to score points and secure a better financial outcome.

Divorce unaided

Amid all the hoo-hah surrounding the cutting out of legal aid, let us not lose sight of the benefits this will bring. Nearly 20 years ago legal aid consumed about £11 billion per annum in divorce costs.

Later, a report commissioned by the Lords and Commons Family and Child Protection Group in 2000 showed that divorce and family breakdown was costing the British taxpayer more than £15 billion a year – and was rising at such a fast rate that society will soon no longer be able to afford it.[3]

The Lords report included the very substantial financial costs to society of rebuilding the lives of both adults and children and included extra spending on Social Security benefits, legal aid, child psychology services and additional health requirements something omitted from official statists. [4] 

The direct cost for Britain’s 26.2 million taxpayers is an average of £11 per week, the report says. The authors estimate that the true costs then – including indirect costs – could be as high as £30 billion. [5]

Analysis of a). divorce reform and b). legal aid from 1945 onwards shows that reform is only the bullet and that it is amendments to legal aid which actually triggers the propulsion of the projectile. If this is true then the removing of the trigger mechanism can be expected to have a dampening effect on divorce number.

Free no longer

Legal Aid used to be free, i.e. it did not have to be repaid, but over the past two decades it has altered so that it now represents legal advice and representation but at knock-down rates, i.e. a discounted price.

In the early years both parties to a divorce petition could qualify but to reduce costs (and not to disadvantage men !) this was restricted to only the petitioner and not the respondent – and since 80% of petitions for divorce were brought by women they enjoyed legal aid and not their husbands – and officialdom viewed this as being fair.

The effect was that wives could out-spend even wealthy husbands with legal aid repayment requirements being secured against matrimonial property which had to be confiscated in the wife’s favour if the debt was to be repaid.

But even that connivance (or is it just coincidence ?) has not been able to save legal lid from the axe in these economically troubled times. 

Marriage and divorce trends

One can assume that the cost of divorce will have risen – even with the administrative cheese-paring that have been implemented in the years since 2004 – so although divorce  numbers have technically declined in recent years it reflect more the fall in marriage numbers than more secure ones (see graph).[6]

Trend in Marriage and Divorce numbers 1931 – 2011

trends_in_marriage2The population of the UK has increased by 10 million to just over 60 million in 2011. By 1991 the number of marriages had already markedly declined from their high point in 1971. As this diagram shows they have continued to decline to the present day. But what this does not reveal is the trend if the population had remained stable at 50 million. Arguably, the trend line would be distinctly lower than is shown in the diagram, drawing it closer to the divorce line (shown by inserted straight trend line). Would there be more or less divorces ? Would there be enough cohabitation unions to off-set this apparent narrowing ?

The decade of the 2000s saw some 145,000 divorces pa that affected about 150,000 children per annum (i.e. 4 marriages in 10 ended in divorce).

From today’s sources can be gleaned that legal aid bills, in some cases, exceeded what people (former wives) were expecting by more than £30,000 (so if someone was expecting a £25,000 bill it instead came to £55,000. See text below).

Open to abuse

Abu Qatada has not woven this intricate web of delay and cost all by himself but with the help of a very competent legal advisor. That advisor is Ben Emmerson, special rapporteur on counter-terrorism and human rights for the United Nations (UN). [7] He has been has strongly criticised ‘water boarding’ as a form of torture but is apparently unmoved by the inhuman actions of terrorists.

His firm, Matrix Chambers, which boasts Cherie Blair as a member has a client list which includes individuals who are less amenable to the idea of human rights as many might recognise them, including Katherine Gun, GCHQ worker accused of breaching the Official Secrets Act. [8]  The persecution was eventually dropped because the war was publicly divisive.

One has to ask the question heard over and over, who’s human rights ? The criminals or the victims ?

Who has more rights ? The criminal or the victim ? The citizen or the foreigner ?

Who deserve state protection more – the soldiers going into battle or the right to have liberal freedoms at any price ?

Instinct, common sense (call it what you will) tells is the once you step outside the law you have no precious expectation of “rights” (as an outlaw, at least, you cannot bank on all of them any longer). This is because you have forfeited your place in society. To do other than this is to weaken the very fabric of society.

The counter argument, sometimes heard cites the line from Shakespeare’s “Merchant of Venice” that:

  • the quality of mercy is not strained . . . . .  It is twice blest: It blesseth him that gives and  him that takes. . . . .”

Yet this is so abundantly corrupting and perverting that a short comment is worthwhile. The premise is that a contract freely and knowingly entered for mutual gain (to gain the heiress, Portia), can be voided without destabilising repercussions on the whole regime if things don’t work out as planned is fantasy.

No mention is made that such a contract between two gentile would probably be enforced. But as a Jew, Shylock feels none of this ‘quality of mercy.’

He is forced to endure racial discrimination, his daughter’s conversion on marriage to Christianity and he suffers the penalties of not being re-paid or offered any other form of recompense. Not content with this, the legal regime threatens to charge him with murder and to escape this he has to agree to become a Christian and sign a covenant so that on his death half his assets will go to his Christian daughter (read ‘new husband / partner’).

Numerically illiterate

A vein of arithmetic ignorance runs through many a sanctified and esteemed academic report and paper. A classic example is that cited by some academics that no more than 10% of divorcing couples seek the powers and protection of the family court to act for them, e.g. Joan Hunt. But as we have seen above, if that were true then 10% of 145,000 would mean that only 14,500 couples went to court. It follows that on 10% of 150,000 children of divorcing couples, i.e. 15,000 would have their future ordained by the courts.

This is a ludicrous position to adopt given the number of CAFCASS reports made every year, circa 60,000, and the number of residence and contact ‘orders’ recorded by courts, circa 90,000 pa. Such numbers would mean that the UK court system would not be groaning under the strain of the sheer numbers and not have a large backlog.

A report by the Legal Ombudsman points to ‘family disputes’ currently giving rise to more complaints to the Legal Ombudsman than any other type of dispute. Around 18% of all the complaints investigated (approx. 7,500) handled by the Legal Ombudsman in 2011-2012, were about family law with just over half (i.e. 9%) related to divorce [presumably the remainder being occasioned by custody and adoption cases etc, one supposes – RW ].

The cost of legally aided divorce accounted for 27% complaints to the Legal Ombudsman (between 1st April – 31st Dec. 2012).

  •  NB. ‘A BDRC legal benchmarking study recently estimated the average cost of a legally aided divorce at around £1,300 per person.’ (The average cost of a divorce for a husband, i.e. not legally aided would be approx. ten times that amount, i.e. £11,300 – RW).

Some 13% of legal aid clients (1 in 8) who were ‘dissatisfied’ with their lawyers in divorce cases almost double the level in other areas of the law. [9]

A significant minority of divorce complaints (a little under 20%), involved a failure to provide an adequate service. This was often in the form of poor information.[10]  For example:

  1. In one case a woman was charged £15,000 more than had been agreed at the outset, including £4,000 for photocopying, despite asking for proceedings to be stopped.
  2. In some cases bills exceeded what people were expecting by more than £30,000.

The latest legal aid cuts, due to be implemented in Aril 2013, will result in a significant decline in publicly funded divorces and a fall in divorces generally should be expected.

One suspects that without legal aid for immigration cases a similar fall would be seen and government would gain an advantage over how many people abuse the system to stay when not wanted and to ‘over stay’ their permitted visa expiry date.

Billion dollar savings

As the process of quantifying of cost savings begins, the slovenliness and sloppy-thinking in the upper echelons becomes apparent. The report by the Legal Ombudsman is a case in point. He writes:

  • “ . . . . Changes to legal aid mean that an estimated 200,000 fewer cases each year [5] will be eligible for publicly funded legal representation. People who previously were able to fall back on state help to fund their divorces will now have to fund them themselves; many low to middle-income earners will have to manage their legal budgets carefully. There will also be an increasing onus on lawyers to help them do so.”

Normally one would not have any reason to question the ‘200,000 cases a year’ number from such an unimpeachable source. Yet you have to question it because there were only on average only 145,000 divorces in the previous years and the trend has been downwards. In fact the latest ONS statistics for divorce shows that: [11]

  • “The number of divorces in England and Wales in 2011 was 117,558, a decrease of 1.7% since 2010, when there were 119,589 divorces.”

Divorces in England and Wales – 2011 http://www.ons.gov.uk/ons/dcp171778_291750.pdf

So where did the Legal Ombudsman get his figures ? Footnote [5] see above quotation holds the key – the Legal Ombudsman takes his numbers not from ONS or Judicial Statistics but from a BBC website (see http://www.bbc.co.uk/news/uk-21611496).

How, one has to ask, could his report, which according to the Google search page carries a Dec 2012 publishing date, was able to quote a BBC webpage dated 28th Feb 2013 one can only imagine (having once worked on a BBC pilot committee I can attest to the BBC’s unnerving ability to tap into distant veins and themes).

This is the expected divorce reduction as stated on the BBC website and which is cited in the Legal Ombudsman report:

  • “In April, cuts to legal aid will result in 200,000 cases a year of divorce and family breakdown being removed from public funding, meaning more people will be paying privately.”

With only 117,558 divorces in England & Wales there will either be no divorces after 2014 or someone hasn’t done their sums.  [12]

Estimated costs

It would be misleading to suggest that £30,000 could be saved on each and every divorce. Such a proposition would set the annual cost of divorce at a staggering £4.3 billion (£30,000 x 145,000 = £4,350,000,000), or marginally less, at £3.5 billion, if slightly better figures are used (£30,000 x 117,558 = £3,526,740,000).

But as these totals relate only to legal aid spent on behalf of female spouses, it begs the question what are husbands having to pay to counter this legal representation ? They will be paying full market price and so the ‘assumed’ average cost to them of £20,000 does not look extraordinary.

Husbands   117,558 x £20,000 = £ 2,351,160,000

Wives        117,558 x £15,000  = £1,763,370,000

                                                                       £4,114,530,000

This rough calculation indicates the true spend on the divorce industry is really in the region of £4 billion pa. It is claimed that the government wants to cut £350m a year from the £2.2bn legal aid bill  [13] but accessing the extent in family law alone this will probably be easily exceeded.

E N D
Annex
 

Reforms are needed

Source : http://www.independent.co.uk/voices/editorials/leading-article-abu-qatadas-hard-case-is-making-for-good-law-7654713.html

t the nub of the  Abu Qatada fiasco is  Article 6 of the European Convention on Human Rights and the way the European Court of Human Rights operates.

Representatives of the Council of Europe’s 47 members meet today in Brighton to consider improvements  to the operations of the European Court of Human Rights.

The court’s backlog of 150,000 cases shows, change is needed. But revisions to its principles of subsidiarity – the idea that as many decisions as possible should be left to national courts – and “margin of appreciation” – the scope that domestic courts have for interpreting the European Convention on Human Rights – must proceed with great care. They must not be driven by Eurosceptic hysteria about the court’s supposed bias. Its decision last week to approve the extradition of Abu Hamza and four other alleged terrorists to face trial in the United States should give the lie to such silliness.

Russia Responsible for 50% of backlog

Yet reforms are needed to deal with the fact that more than a quarter of the backlog is down to petitions to the court from one country, Russia. Applications to the court should not be considered if they are substantially the same as matters previously considered by the court. Better measures are clearly needed for screening out cases at lower levels.


Footnotes:

[1] In 1999 was sentenced by Jordanian court authorities in his absence

[2] British Nationality Act 1948. She applied under section 6 of the 1948 Act. Section 6 gave an apparently unqualified right to any woman married to a United Kingdom citizen to be registered as a citizen of the United Kingdom. See Puttick -v- Attorney General; Regina -v- Secretary of State for the Home Department ex parte Puttick [1980] Fam 1; [1981] QB 767

[3] Lords and Commons Family and Child Protection Group, pub’d by the charity “Family Matters” 14 Sept 2000 http://www.independent.co.uk/news/uk/this-britain/divorce-costs-each-taxpayer-pound11-a-week-698711.html

[5] David Lindsay and Robert Whiston

[8] In the period before the invasion of Iraq (Jan 2003), a British intelligence officer working as a translator at the highly sensitive GCHQ was charged with leaking a top secret e-mail. She claim she was trying to prevent what was in her opinion the “unlawful war” in Iraq.

[9] “The price of separation: Divorce related legal complaints and their causes” http://www.legalombudsman.org.uk/downloads/documents/publications/The-price-of-separation-LeO-report.pdf  

[10] ‘Rising costs add to divorce woe, says Legal Ombudsman’, 28/2/13 http://www.bbc.co.uk/news/uk-21611496  Chief Legal Ombudsman Adam Sampson.

Waiting for women

Women are confused as to their role in society and as per usual it’s everyone’s fault but their own.

On the one hand you have both the feminist and lesbian types blaming men for the female predicament – American feminist author Jessica Valenti (left), falls roughly into the former category .

While on the other hand you have the still-romantic journalist types like Bryony Gordon, features writer for the Telegraph (right).

Discussing almost the same subject – hinging on marriage and children – both come to widely divergent views.

As one might expect from a kid born in 1978 to an Italian – Buddhist family Valenti lacks the heritage and sense of identity in her outlook. She is the product par excellence of her age, an age where feminism had warped society into ‘the normal.’ She has no experience of the normal before it was changed by feminist values and she is the poorer for it.

Valenti is credited with taking feminism into the on-line world which must have left her more elderly colleagues high and dry in the old mediums of communications. For that reason she can be said to falls roughly into the same category. If her book titles are anything to go by she might be a welcome breath of fresh air.

  • “Yes Means Yes: Visions of Female Sexual Power and A World Without Rape” (2008).
  • “The Purity Myth: How America’s Obsession with Virginity Is Hurting Young Women” (2009)

‘Why have kids?’ is the title of her new book, but the content is a rehash of feminist arguments made in the 1970s – the ‘barefoot and pregnant’ invective of the Erin Pizzey era.

  • ‘Why have kids ? Guilt and self-flagellation’ of motherhood is making women wish they never had children’.
    “One of the most important things is to get rid of the idea that it’s best for kids to be with their parents as much as possible,’

Somewhat ignorant of the realities of life – and the research – she then goes on to say:

  • “that research shows children do better when they have numerous people – parents, grandparents, friends – assisting their development.”

Yes, Ms. Valenti (married mother of a 2 year old daughter), children do better when they have numerous people around them – usually they’re called Mother, Dad and grandparents.

Dummkopf  ! !

Sharing the load of raising children is precisely what the family unit of father, mother and grandparents was created for. Why try to reinvent the wheel ?

One wonders whether she is also thinking in the back of her mind about the position of divorced mothers when she writes:

  • ‘I think it’s hard for some mothers to let go of that maternal power, especially when that might be all the power that you have.’ And thirdly, moms have to ditch the belief that their child should be the centre of their world.

Is that a confession from the new generation of feminists that ‘ego’ and ‘self’ come first, and that a job, sorry, career comes even ahead of a child’s best interests ?

  • ‘I am a person first and a mother second and I think it’s weird that that idea is seen as being controversial. We don’t demand the same thing of fathers. We don’t hear men saying ‘I’m a father first. Being a person first doesn’t mean that the depth of love that you have for your child is any less intense.’

Clearly Valenti does not have a way with words or is mesmerised in some way. Being a person and also a parent are not contradictory but fully compatible and interchangeable. It displays a certain shallowness to see both as competing for a ranking position.

Another view

Bryony Gordon is the daughter of divorced parents and sees herself as somebody who has long dealt with that situation and with the fact that she thinks will never get married (23 Jan 2009).[1]

Is she mad ? Look at her picture. We have all seen many a heifer-like bride walking up the aisle. Why do women forever lack self-esteem ?

Such opinions should buoy her up but strangely, she recalls how the prospect of never getting married leaves her feeling rather flat.

  • “A world without marriage seems like rather a bleak one, doesn’t it? Instead of dreaming of a white wedding fit for a princess, little girls will instead have to dream of co-habitation. Mmm. Yeah. Great.”
  • The problem with marriage, though, is that it has become about weddings, and big, showy ones at that. The latest figures put the cost of the average bash at £21,000 – a year’s wages for some. It seems that you cannot get married today without “his and hers” thrones, a horse-drawn carriage and a ceremony at a grand country house.

Marketing and consumerism have invaded even weddings. The “Hello” magazine syndrome of aping the Beckham’s celebrity wedding has infected the entire population of unmarried women.Every shop assistant bride-to-be has this has her ideal.

  • Then when the champagne hangover wears off, husband and wife realise that marriage is for life, not just a day when you get to wear a great big monstrosity of a frock and dance to a cheesy disco.

Bryony Gordon concludes by saying, we should perhaps take our time to reacquaint ourselves with marriage’s true values. It would be a mistake to divorce ourselves from it just yet.

When women eventually decide what they want can they please tell us ?  Meanwhile, what are we as mere man supposed to do ?

E N D

[1] “Marriage is for life, not a day in a monstrous frock” Bryony Gordon, Telegrpah, 23 Jan 2009 http://www.telegraph.co.uk/comment/columnists/bryonygordon/4326420/Marriage-is-for-life-not-a-day-in-a-monstrous-frock.html

Immigration Deceit – Part 1

Robert Whiston  FRSA   Sept 2012

No Bolt from the Blue

Politicians, bankers and their assorted acolytes have by now been written-off by the general public as inveterate ‘spivs’, compulsive liars and fakers-of-fact. The news, therefore, that so august a body as a university falls into the same category is profoundly shocking.

London’s Metropolitan University stands accused of fraud and undermining government policy. It has been stripped of its Highly Trusted Sponsor status following concerns (surely a euphemism) that the university was unable or unwilling to control immigration visas it issued to students attending college courses (allegedly some did not attend their designated course).

The university failed to address serious and systemic failings that were identified by the UK Border Agency six months ago in regards non-EU students. [1]

The scandal has inadvertently lifted the lid on a toxic mixture that has seen politicians, civil servants and ‘the establishment’ working in unison to deliberately deceive the public for over 10 years. They have known all along what has been going on and have used the media to blindside the public. This article is not a unique ‘expose’ as such but it does bring together aspects of the subject that others would prefer were kept in their separate boxes.

Parliament was told by Immigration Minister, Damian Green that the London Metropolitan University had failed in three particular areas:

  • More than 25% of the 101 students sampled were studying at the university when they had no ‘leave to remain’ in this country
  • Some 20 of 50 checked files found “no proper evidence” that the students’ mandatory English levels had been reached
  • And some 142 of 250 (57%) sampled records had attendance monitoring issues, which meant it was impossible for the university to know whether students were turning up for classes or not.

Damian Green MP quoted two additional samples, covering 600 files, which found a problem in more than 60%, he told the House of Commons.

A tidal wave of events

The Home Office has become too big to remain efficient. Not only it is supposed to regulate immigration but it also pays solicitors to represent immigrants and have its own rulings overturned. The ‘UK Border Agency’ is like so many other outwardly independent agencies – really a rebadged section of the Home Office which is done in the hope that the agency and not the HO will take the flak for any incompetencies.

All has not been well at the Home Office for some years. Putting this into context one has to recall that it was John Reid MP as Home Secretary damned his department’s immigration operation (23rd May 2006), as “not fit for purpose” with “inadequate” leadership and management systems. [2]

Compounding the immigration-and-university scandal is the role of arch-feminist Liz Kelly.

Right: John Reid MP

She has worked for the Home Office peer reviewing papers and overseeing its publications esp. on issues of domestic violence and rape while being on the staff of scandal-hit London Metropolitan University.[3]

It is only with the publication of the Stern Report (2010) that we realised the Home Office figures on rape and rape convictions (HORS 276, pub 2004) had been hopelessly inaccurate for years and manipulated, one has to suspect, for political ends.

Clamour for status

For several years past and following the ‘big bang’ in university numbers Chancellors of lesser universities have been complaining to government that they simply haven’t enough money to run courses.One suspects that ego and self-aggrandisement perhaps blinded staff and Vice Chancellors to the cost structure associated with changing status to a university. London Metropolitan University itself was itself a polytechnic until 1992 after which it merged (to survive ?) with several other London colleges, e.g. Sir John Cass.

When the furore dies down we will probably see that this was all about generating greater income from attracting overseas students and to hell with the consequences. Events having priced many local British students out of the market it makes perfect sense to fill the gaps by opening a recruitment office in India. After all, for every £8,000 a local student brings in fees for the college coffers an overseas replacement will bring in fees of £12,000 (illustrative examples only).

The Telegraph (Sept 4th 2012), citing a warning by the UK Border Agency, reported that, “An extra 50,000 bogus foreign students were able to enter the UK because of “extraordinary chaos.” [4]

That was the equivalent of one in six of all foreign students who arrived in 2009, when the system was introduced. [5]  And three years later it is still in turmoil with officials playing “catch up”, according to the Commons Public Accounts Committee.

The figures were based on estimates by the National Audit Office and represented some 16% of the 313,000 foreign students who were granted visas to study in that year.

Out of control

Six years on from John Reid’s confession to parliament and nothing has changed. Immigration controls were chaotic then and they remain chaotic today. What are civil servants doing and why are we still paying them ?

It would seem thatBritain’s immigration control mechanisms – such as they are – are under attack from within and without. There are greedy, desperate and/or ambitious universities (though the pleas is that this scandal is a one-off incident), and there are ineffective controls at our national borders – compounded perhaps by laxness at UK consular offices overseas who employ ‘locals.’

This is to say nothing about crooked businesses large and small that warp the system for their own enrichment – from international banks e.g. Deuthchebank in London, to local builders who all want cheap labour.

According to ONS estimates – and they are only ‘estimates’ – the total long-term immigration to the UK in the year to September 2011 was over ½ million (589,000).

This compares to 600,000 in the year to Sept 2010 and the level of long-term immigration has remained at a similar level since 2004 – that’s 1 million extra people every 2 years for the last decade.

“Immigration,” sadly covers a multitude of diverse categories. Canada, to give just one example, categorises immigrant numbers and percentages as follows (but excludes students):

  • Economic immigrants
  • Family class
  • Refugees
  • Other.

Fortunately, we have a Home Affairs Committee report for 2010–11 into the subject of ‘Student Visas’ and the problems they can cause.[6]

The table below shows a). the annual level of student visas issued and b). the cumulative total of over 1¼ million.


Comparing 2005 with 2009 a clear 100,000 additional student visas were issued indicating either endemic fraud or Britain being realised as a No 1 educational destination. According to Andrew Neather’s revelations (see section below) it is more likely to be the former.

The Establishment’s excuse

The usual excuse deployed by authorities for any abuse or breakdown in the immigration system is to turn the tables and claim that the price is worth paying because ‘these young people create jobs and bring dynamism to the British economy.’

Are these apologists suggesting that English young people are less enlightened and too incompetent to bring jobs and dynamism to the British economy ?

Are they suggesting that British young men and women will never be as dynamic and generate large quantities of wealth ?

How many young British men and women – with or without armfuls of qualifications – have made their way to London to seek their fortune ? And hasn’t it always been this way ?  John Major, lest we forget, became prime minister despite having no formal school qualifications.

As if to contradict its own numbers the same report from the Home Affairs Committee states that:

 “The total number of student visas issued and refused in 2009 was 303,635 and 104,536, respectively.”

In economic terms, an extra million young people in the labour market leads (surprise, surprise), to a suppression of wage rates, a constriction of demand and thereafter a slowing down in living standards – the more so since the middle aged have now become a growing sector of the permanently unemployed.

The squeeze this induces within the economy is ‘deflationary’ and the perennial handicap to growth in the British economy, namely ‘inflation’, is snuffed out in the process. This was ably demonstrated in the last recession of 1990 – 1992. By 1996 the economy had recovered and speaking some years later John Major (the then PM) said:

  • “I inherited a sick economy and passed on a sound one”.

That “sound one” came at the price of wage deflation, i.e. a fall in real purchasing power. Now we have neither a sound economy nor purchasing power which is recovering. We have had quantitative easy (printing money) but any assumption about an increase in the resulting easing of credit and velocity of circulation of money is this time not pulling us out of near-global recession.

The Final Solution ?

Finding we have been pushed deliberately into first a banking crisis and then a recession by the same set of incompetents, all of this sets the scene for the immigration issue grating on the public’s consciousness.

We have no better confirmation of this conclusion that the testimony of Andrew Neather, a former adviser and speech writer to Tony Blair, Jack Straw and David Blunkett. There was he says in a 2009 article, a “deliberate policy”, from late 2000 until “at least February last year”, to hugely increases immigrant numbers over that decade.

According to Andrew Neather, the deliberate policy owes its genesis partly to a politically motivated attempt by ministers to radically change the country but also to “rub the Right’s nose in diversity” (a new term for ethnic groups), and making multiculturalism irreversible. [7]

Opening up the UK to mass migration and social engineering on such a scale, naturally made all Labour’s ministers nervous. They were “reluctant” to discuss it publicly for fear it would alienate its “core working class vote”. As a result, the only public argument permitted concentrated instead on the alleged economic benefits immigration brought and need for more migrants. This was demolished at the time by the think tank Migrationwatch, while at the same time it served to give legitimacy to the claims of the far right BNP.

History will perhaps judge this as a racial apocalypse and to be as monumental a mistake as the Nazism’s racial engineering that impacted the Jews.

Finessing the numbers

Elected on a platform that included quickly getting a handle on immigration numbers it would seem the present government is no more successful than their Labour predecessors. The first rumblings about the levels of immigrations were heard in Jan 2012 but the government’s first significant stumble came in June 2012.

Regardless of which political party is in power the mandarins in Whitehall are bent on softening the blow by disguising the real figures with adjusted ones. Some would call it finessing in a thoughtful and responsible way; others would call it “spin”, pure and simple.

The British population has been systematically and very deliberately lied to for over 20 years. When Michael Howard, himself a son of an immigrant family, advocated stronger asylum and immigration rules in 2004 he was universally denounced by the media as playing “the race card.”

The Guardian in its leader article of Sept 24th 2004 (“Signs of desperation”) described Michael Howard’s views as ‘extreme.’ The Conservatives went into the 2005 election with a poster asking, “Are you thinking what we are thinking ?” – unaware perhaps of just how prophetic the words would prove to be.

The Guardian (darling of the left intelligentsia), declared “Look instead at facts and history”, which it then went on to define as:

Contrary to Mr. Howard’s assertion the asylum system has not become “chaotic, unfair and out of control”. Far from it. The UK has cut the overall number of asylum applicants by 70% since October 2002.

Sadly ‘the facts’ and the claimed cut of 70% were yet more fiction (spin) but in 2004 the immigration topic was very non-PC and there was no one with the gonads to stand up and say so.

It would be immensely non-PC – but true nonetheless – to point out how Michael Howard and Winston Churchill were each prescient in their own era (respectively, immigration and Germay’s rearming). John Reid’s admission two years later, in 2006, serves to underline the accuracy of Michael Howard’s information.

By 2012 there was an acceptance by both major parties that immigration was indeed a troubling social issue for the ordinary working man (i.e. the voter) and that it was a failed policy – little mention was made of its employment effects. We have since learnt that it was more rudderless than a rudderless ship and all the supposed ‘control mechanisms’ had, in fact, long ago rusted up.

In buoyant times no one minds too much about immigration as the economy can absorb all the additional demands placed upon it (school places, housing, health care and medical costs etc). The cost to the general taxpayer is marginal. The pockets where these immigrants congregate are more easily reached and government’s tax take is thus spread wider.

However, a recession brings job scarcity, especially among the majority of the working class who are most affected which ushers in a time of reflection.

No one minds immigration abuses in buoyant times because the impact is not felt, budgets are not pruned, short-time working is not a factor, and the published numbers look acceptable. In fact, the ordinary man in the street would be hard pressed to decide whether “emigration” meant people leaving the UK or people coming into the UK.

Immigrant numbers

In 2011, immigrants (people who arrived in the UK), totalled 593,000. [8]  For the year 2011, emigrants (people who left the UK), totalled 338,000

This is where the headline figure Net Migration for 2011 of 252,000 comes from (593k less 338k). 252,000 – or half the actual immigration rate.

How much more palatable it is to use the net migration figure of 252,000 when it is half the actual immigration total.

It must be emphasised that all these figures are ‘estimates’ since there are a dozen or so groupings where, for instance, immigration status and been denied but the person can no longer be found or ‘leave to stay’ has expired and once again the person has disappeared, or the student visa system has been abused for work in the grey economy.

Of the 593,000 foreigners who arrived in 2011, most were from Asia and Africa. This was an increase over 2010 when 582,000 such immigrants came to settle in Britain. On this one count alone the Conservative policy is failing – just like its predecessor’s.

Canada by comparison

Canada dwarfs the UK geographically. At 3,855,103 sq miles versus Britain’s paltry 94,060 sq miles it is a giant among nations.

To get some scale of the problem it is perhaps helpful to put immigration in geographical terms. In land area terms the UK is roughly comparable in size to the small east coast province of Newfoundland.

Yet Canada has a strict immigration policy that absorbs only 285,000 per annum. With a population of 34 million it can afford to be expansive in its vast and vacant hinterland (save for the highlands of Scotland Britain has no such luxury). [9]

In 2001, Canada accepted 250,640 immigrants, relative to a total population of 30 million (Pop’n 30,007,094 ref. 2001 Census).

By 2010, when Canada’s population was 34 million it was accepting 280,681 immigrants per annum (permanent and temporary) of which:

  • 186,913           (67%) were Economic immigrants
  • 60,220             (22%) were Family class
  • 24,696             (9%)   were Refugees and
  • 8,845               (2%)   were Other.

Compare those figures circa 285,000 per annum with the 593,000 immigrant who entered Britain.

In the aftermath of the universities dishonour and subsequent UK televised debates Canada has been cited as being the ideal for us to work towards yet even Canada is having trouble with controlling immigration and bogus student visa claims (see also Part 2).

The number of Canadian student visas issued in India rise from 3,000 in 2008 to 12,000 in 2010.

This is set to rise to 25,000 student visas in the next two years, as Canada sees education as a big revenue generator. It also is for Britain but in polite circles any talk of money is seen as gauche and distasteful.

But all of this comes at a time when Canadian immigration officers in India have come under criticism for rejecting 80% of ‘tourist visa’ applications in Chandigarh and about 50% in New Delhi. [10]

‘Hot spots’ like this hint at an organising hand – an eminence gris – behind the scenes and this may also be true of  London Metropolitan University and at the boat-people trying to get into Australia.

Unless one has lived in the Third World it is difficult to appreciate the non-occidental mindset and the shenanigans (bribes, back-handers etc) that are taken locally as commonplace. A peasant farmer subsisting on $10 a month in any of  a fist full of countries you could name, will still find a means to lay his hands on $14,000 for a passage to the West or Australia.

Archaic machinery

The blame lies with the machinery controlling immigration and with the machine operators in Whitehall. In the summer of  2011 Robert Brodie Clark, a Home Office civil servant in charge of immigration, had relaxed Biometric controls for not just EU citizens to speed up processing as intended but for non-EU citizens too.[11]

Responsible critics and even the general public have been loftily dismissed and driven into silence by claims of xenophobia and that they are not seeing the bigger picture – the ‘enriching’ of society and generating jobs argument made above.

One of those very early ‘responsible critics’ was Steve Moxon who worked in the Home Office and could see for himself the catastrophe of the alleged policy. It was nothing more than mishmash or arbitrary decisions set against a hodgepodge of intended objectives.

Is it so utterly unrealistic to listen to the opinions of the ordinary man in the street ? Apparently it is, so without whistleblowers like Steve Moxon (who had to sacrifice his job), the news would never have been made available to parliament and the people.

It is suspected that it was he who provided Michael Howard, leader of the Conservative opposition (circa 2002), with the true figures for immigration and accurately pointed to where the system was breaking down.

He highlighted how the Home Office knew about massive “fraudulent circumvention of immigration controls” and yet did nothing about it. He calls it ‘news management’ and the Home Office has been found ‘managing the truth’ about everything from the number of rape prosecutions (see Stern Report) to immigration.

Steve Moxon views are most relevant and he gives us an insight into how the Home Office like a drunkard crashing into one lamp post after another, operates. He runs his own blog site and his opinions can be read at: http://stevemoxon.blogspot.co.uk/. The following comments are about the earlier regime and are especially prophetic.

  • “A student visa application needed to be checked so that:
  • 1. there is a genuine acceptance by an educational institution
  • 2. that the student has enough funds to support him for the course without recourse to working and
  • 3. that the student is who he/she says he/she is.”
  • None of these were done when I was in post. Sponsorship letters could have been in Chinese and we would be told to accept then.
  • No financial records were required in practice. Any old letter looking like it’s from a college would be taken as genuine. Everything was simply taken on trust.
  • No forgery training was available. Any reference to a senior course worker resulted in instruction to grant the visa anyway.”
  • The potential for terrorists is obvious, as is the lack of a system to detect illegal economic migrants.”

National Insurance Numbers

Evidence that immigration is far from a tightly run ship can be found in the number of National Insurance Numbers issued. The NIS (National Insurance System) makes it essential for all workers in the UK to have a NI number so that the correct income tax can be deducted and current housing schooling and future hospital and pension costs etc are met.

The total of National Insurance numbers issued by Government is far higher than the official level of immigration. Between 2004 and 2007 (Labour government),  270,000 work permits were issued by the Government to non-European nationals, yet over 900,000 National Insurance Numbers were issued.

Assuming that total immigration was around 250,000 per annum (as preferred by government) then in the 4 years between 2004 and 2007 the totals would more or less tally. But if the true figure for immigration is used, i.e. around 500,000 per annum, 900,000 account for only 18 months inflow. What has happened to the influx for the other 2½ years ?

Density

Britain is one of the most densely packed countries in the world. In London and South East the population density is just under 13,000 per square mile. The average density for the UK as a whole, which is still one of the highest in the world, is 660 people per square mile. This compares with an average Canadian figure of 9 people per square mile.

Yet even with all that unpopulated lands mass Canadians still felt intimidated by the numbers flowing in to their country:

  • “The reality is that Canada’s 250,000 per year immigration intake since 1990 has been far too high. In fact, Canada’s intake is the highest per capita in the world. And, contrary to the claims of our political parties, it has obviously been destructive and senseless.” [12]

It may indeed be the ‘highest per capita in the world’ but at least they have vast open spaces into which they can expand. Britain by contrast has bred a vast number of ethnic ghettos into which overstaying immigrants can disappear.

In contrast to the “Canada’s intake is the highest” view is the position taken by Canada’s iimmigration attorneys who are critical of the rejection of visitors’ visas without detailed explanations.

They claim that the system has only three boxes, and invariably the box saying ‘you have no attachment to your home country‘ is checked.

They imply this bears down most where the ‘applicant is young, not married, has no substantial bank account or real estate in his/her name,’ implying that the applicant has no stake in India’ and may not leave Canada by the due date. http://www.rediff.com/getahead/report/student-visas-issued-in-india-to-double-in-two-years/20110128.htm

Black Art

Ascertaining true immigration numbers proves so unreliable that it is becoming more of a black art than a science. The 2001 Census has become a by-word for inaccuracy, with huge data gaps that have had to be filled in by educated guesswork.

Slough Council, for example, reported that no fewer than 30,000 people were missed in their borough alone. Repeat this by 1,000 towns and the level of inaccuracy become jaw dropping.

As if to emphasis this inadequacies we find that supermarkets are able to predict population levels by the amount of food purchased. Reputedly a leading figure at the TESCO supermarket chain said in 2008 that:

  •  “ . . . [we] estimate the population of the UK to be closer to 80 million, based on the volume of certain staples that [we] sell.” [13]

This was backed up a major, non-commercial agricultural institution which reckoned that there are not 60 million as stated by ONS but 77 million people currently in the UK, this figure again based on how much we eat. NB. The 77 million people figure is widely cited but an original source cannot be found. [14]  The closest found to date is in an Independent article by Martin Baker dating back to Sunday 28th October 2007: [15]

  • “ . . .  the population of the UK is presently somewhere between 77 and 80 million.”
  • “Consumption – that’s the thing. Based on what we eat, one big supermarket chain reckons there are 80 million people living in the UK.”

Meanwhile, a week earlier to the Independent’s 2007 article, ONS published its predicted population of 75 million which would only be reached by 2051. [16]  The Daily Express may not be one of the nation’s high brow “quality” newspapers but the same reporter Leo McKinstry  has previously been shown to be on the money, e.g. “The Age of Unreason” in the ‘Spectator’ (April 23rd 2005). In his assessment in the Daily Express article (July 16th 2012) he includes:

  • But the opposite [ the “enrich our culture” argument ] has been true. Immigration has been a vehicle for economic destruction and social disintegration. With 90% of new jobs going to foreigners, millions of Britons have been thrown on the economic scrapheap, while the taxpayer has had to cope with the mammoth costs of providing healthcare, schooling, welfare and social housing to much of the migrant population. 

If we speak in specifics the situation becomes farcical, just 1,455 Nigerians were given ‘leave to enter’ Britain, yet in the same period 35,900 Nigerians got NI numbers.

In a recent announcement the BNP states that, “Around 25,000 asylum applications are received each year, and previous Office figures have revealed that at least 92% are allowed to stay, even if their applications are rejected.[17]

Apart from the obvious root of the problem, namely that of immigration controls that are non-existent, is the complications caused by a National Census which has not changed significantly since it pre-Victorian origins (1801).

The Census regime operates in order to obtain numbers, and the system relies entirely on morality and honesty prevalent in the 19th century for its accuracy. All Census returns rely on ‘Head of householders’ who have to fill in a long-winded form. It is therefore not difficult for people lacking linear honesty to evade, or give misleading answers which an incompetent state bureaucracy is unlikely to pick up on or identify.

Now Go To ‘Part 2’ https://motoristmatters.wordpress.com/2012/09/27/35/

E N D

Footnotes:


[1] Technically the “European Economic Area”

[2] “Immigration system unfit – Reid”  http://news.bbc.co.uk/1/hi/uk_politics/5007148.stm

[3] For instance, by Sylvia Walby & Jonathan Allen’s paper on DV and sex offences contained suspect data that should have not been accepted but as a commissioner and reviewer of literature Liz Kelly nodded it through. HORS 276 (2004)

[5] UK Border Agency (UKBA) was created in 2009.

[6] http://www.parliament.uk/documents/commons-committees/home-affairs/Studentvisas.pdf 

[7] Labour threw open Britain’s borders to mass immigration to help socially engineer a “truly multicultural” country, a former Government adviser has revealed http://www.telegraph.co.uk/news/uknews/law-and-order/6418456/Labour-wanted-mass-immigration-to-make-UK-more-multicultural-says-former-adviser.html  

[9] Scotland has in fact a declining population attributed to migrating south into England and overseas.

[11]  The Home Secretary made a statement to parliament on 7 Nov 2011 setting out the causes for concern. See http://www.guardian.co.uk/politics/2011/nov/08/brodie-clark-resigns-theresa-may And http://en.wikipedia.org/wiki/Brodie_Clark   

[12] IWC – Immigration Watch Canada

[13] Conservative MP Greg Hands, ‘Tories Fail to Solve Immigration Crisis that Blights Britain’ July 16, 2012

[16] ‘Tories Fail to Solve Immigration Crisis that Blights Britain’ By Leo McKinstry  July 16th  2012. http://www.express.co.uk/posts/view/333097/Tories-fail-to-solve-immigration-crisis-that-blights-Britain

Immigration Deceit – Part 2

Robert Whiston FRSA   Sept 2012

PART II:  

‘THE CLOSING OF THE BRITISH MIND’ – the immigration disgrace and the university student visa scandal.

Part 1 was subtitled “No Bolt from the Blue” hinting at a pre-existing knowledge by both those that wield elected and unelected power – the oligarchy every nation spawns, and across the ages from Homer to Pliny. But in so doing they are inevitably sowing the seeds of their own destruction. In Part 2 we see the social cost and the political price which some have already paid. In common with deceitful bankers, deceitful politicians are having their bluff called.

Population complexity

Standard operating procedure in government circles is to set up an inquiry or a committee to investigate any perceived problem. This buys time and mollifies outraged voices.

Immigration is no different. The left-leaning think tank, the IPPR, in an article entitled “Does Immigration Cause Unemployment ?” dated January 2012 refers to the Migration Advisory Committee (MAC), a committee of economists set up to advise the government on immigration policy. [1]

  •  “The MAC confirms the finding from previous studies that immigration does have an effect on wages: it finds no overall effect, but a negative effect on lower-paid workers, offset by a positive effect on higher-paid workers.”

So those that are in some way better placed and have higher incomes have their incomes boosted still further. Meanwhile the majority – those on low incomes – have their suffering and poor living standards further eroded. 

As we have seen above this was deliberate Labour Party policy. No wonder Blair’s ministers fell silent about it at the time and no wonder they are now afraid they have alienated their core voters.

Somewhat optimistically and disregarding migration watch figures Migration Advisory Committee goes on to conclude that:

  • ‘What will make the headlines, however, is that for the first time ever in a government-sanctioned report, the MAC finds an ‘association’ between immigration and employment. In particular, the MAC estimates that: ‘an extra 100 non-EU migrants are initially associated with 23 fewer native people employed’.

Those who are MAC or IPPR salaried staff might be able to draw comfort from the fine distinction that greater unemployment is only due to non-EU migrants rather than directly relating to EU migrants. It is a nuance lost of those with no jobs.

As is customary in a paper whose authors float well about the clouds they feel the need to highlight a number of cautionary points to justify their position. These, it turns out to be, include no more than the point already made here, e.g. distinguishing immigration’s impacts during periods of economic growth and economic downturns.

The IPPR reports that MAC had not found a ‘causal link’ but merely ‘an association’ and relates how MAC admits to some important limitations on the robustness of its results.

A further report cited by IPPR is the Jan 2012 NIESR, report which looked at both EU and non-EU migrants. [2]  Intriguingly the NIESR report cites ‘immigration’ in relation to National Insurance number registrations issued and is the first major study to use data from national insurance numbers. Yet despite the huge quantities of NI numbers issued NIESR report concludes report finds no link between immigration and unemployment – which curiously parrots the findings of most previous studies.[3]

In a Press Release (May 2012), the IPPR says that only 15% of students stay permanently in Britain and contribute to long-term net migration after graduating. For this reason they argue that the government should adopt a more rational method of not counting students unless they cease to be transitory. This would certainly help clean-up and demistify immigration statistics. Although this would have little impact on real long-term gross immigration and ‘net migration’ it would give the appearance of bringing the numbers down.  Under the IPPR’s alternative suggestions students would disappear from immigration statistics balance sheet as they have in other countries.

The only drawback with this idea is that it fails to address the present problem which is those bogus applicants, the so-called student who disappear within their own ethnic community ghettoes. Would being “off balance sheet” encourage more overstaying and illegal use of student visas ?

A cosy consensus has existed for a long time between the political parties over how to treat immigration. Both the present and previous governments believes that immigration ‘enriches our culture’ and strengthens our economy but now the Conservative attitude is that under Labour placed unacceptable pressure on public services.[4]

Population complexion

Those ‘pressures’ manifested themselves in health care facilities, GP services, dentistry, housing and school places.

Scotland’s Cardinal Keith O’Brien is not the first to voice his concerns over population numbers. The tens of thousands of immigrants per annum will, within the lifetime of two or three parliaments have reproduced to the level of hundreds of thousands. We already see this in Ulster where the Catholics are “out-birthing” the Protestants.

Recalling a recent visit to Austria his host explained:

  • ‘You know, we are losing our Christian Catholic community. We are not having babies, but the immigrants, they love babies, love families, love family life, have many, many children, and soon they will be taking over’,”

Cardinal O’Brien has asked that Catholics have more children or face seeing their faith eclipsed by the religions of immigrants. [5]  His remarks risk sparking a political debate but he has said that members of the [Catholic] Church hierarchy fear immigrant groups could:

  • ” . . . take over in western European countries because they have more children than indigenous Christians”

Scotland is in a dilemma. The Scottish Executive under the leadership Donald Salmon wants to encourage more immigrants to come to Scotland because it is fast being de-populated, while the Tories warned earlier this month that, uncurbed, the flow of migrants could threaten traditional British values.

The demographics

Both England and the USA already have significant numbers of immigrants in their populations – the same could be said of France and Canada. But of the 4 states it is the US and Canada that have had and need a programme of immigration. England, generally speaking, is already overpopulated and France is slightly under-populated given its land mass.

A distinguishing mark is that immigration which is said to have ‘made America strong’ actually threatens to ruin Europe. Undoubtedly the immigration waves of the 18th, 19th, and 20th century (sanctioned by the US Congress) were planned and managed and essential to build-up an empty hinterland – without people there is no economy.

However, immigration fails to make Europe strong principally because the above does not apply but also because all EU countries have a welfare state apparatus.

Immigration made America strong because it had no welfare state commitments – every settler had to fend for themselves and so the cost of attracting, settling the people needed was exceedingly low.

The common problem faced is that all ‘host populations’ will – or are – finding themselves “out-birthed” and becoming a minority in their own country ( “Average Family Size” is another solid indicator. In Europe it is now well below 2.4). Nowhere is this more acute than in America. The New York Times, May 2012, citing census figures made it clear that birth rate was at the root of the problem: [6]

  • “Overall, the white population is barely above the point where births exceed deaths.”

Many countries in the West have for years lived with the birth rate falling below replacement levels but for deaths to exceed births is a new benchmark.

Left: Non-white births exceed white births in USA for the 1st time

On the same day, May 17th 2012, the Wall Street Journal stated that:

  • “For the first time in U.S. history, whites of European ancestry account for less than half of newborn children, marking a demographic tipping point that is already changing the nation’s politics, economy and workforce.” [7]

Among the roughly four million children born in the U.S. between July 2010 and July 2011, 50.4% belonged to a racial or ethnic group that in previous generations would have classified them as minorities.

For the US this presents a double whammy. An older generation of whites will look at the younger generation who will mostly be non-white. The older generation, as a group, grew up in a largely white world with white traditions and values. The United States has a poor record of educating minority youth out of poverty or their ethnic values.

Will older Americans baulked by the ballot box at paying to educate a younger generation that looks less like themselves ? And will Pres. Obama’s health care ideals, aimed at the poor, the old and ethnic minorities suffer ? Will the trend be away from giving financial help for needy families, e.g. Temporary Assistance for Needy Families (TANF) ? [8]

Arguably, while the increasingly ‘diverse’ young population is a potential engine of growth, will it not become a burden if the poor current educational standards remain static ?

Meanwhile neighbouring Canada projects that, by 2031, almost 50% of the population aged of 15 or more will be foreign-born or have at least one foreign-born parent. The number of ‘visible minorities’ will double and make up the majority of the population of cities in Canada.

In Europe “multiculturalism, once an expansive and all-embracing ideal, has now hardened into orthodoxy and schism. Time to usher in an era of greater openness has passed us by. The schism is not confined to white host versus ethnic immigrant minority but intra-ethnic minorities.

England will face the same dilemmas as the US is the coming years, so close attention should be paid to how the US experience unfolds. The question for both countries is how can we re-imagine the ‘social contract’ between population and state instruments, especially when the two generations may have precious little in common ?  Between the 1991 and 2001 censuses, 50% of the population increase was due to foreign-born immigration (4.9 million people and 8.3% of the population). [9]

It is now pretty obvious that inside Whitehall this problem has been identified albeit not publicised. On Oct 12th 2009 I penned an article about the British context of demographic change and citing D.A.Coleman who was professor of Demography at Oxford. Between 1985 and 1987 worked as a Special Adviser to the Home Office. Therefore, we should give his views due weight.

In 2007 Coleman asked, “Is the ‘Second Demographic Transition sustainable’?”[10] In other words, can we afford the welfare state as we have known it and cope with an ageing population at the same time ?  He used graphs to pose the question (see ‘Projected ethnic change in the UK given 2001 data’).

Below: one of Prof. Coleman’s 2007 graphs

The same graph also shows the transition / convergence between the cultural mix and races that may have occurred by 2051.

Therefore, at the same time as government ministers were reassuring the public that there was nothing to fear behind the scenes some elaborate calculations were being made.

There are always implications, usually financial, when social change is a foot. To the question ‘can we afford the welfare state’, an ageing population is unavoidable and some commentators believe, for technical reasons, that the National Insurance Fund will be in a much sturdier position than it was during the 1990s.

Opening balances of the National Insurance Fund (NIF) fell from a healthy position of £10b in 1989 to around £3bn in 1992 – 94 but pensions and state benefits continued to be paid out (ONS Table 3.11).

Professor Coleman also wrote that the “fiscal burdens” including, for example, divorce, adds 15% to Britain’s overall Welfare Benefits bill (£15 bn) and in so doing creates 3 households when only 2 should be needed.

Throughout the 2000’s pensions and how they could be afforded was on top of the political agenda. A committee headed by Adair Turner was asked to examine the matter and in April 2006 the last of their reports was published. It signalled 1/. the death-knell for private firm private pension plans as unaffordable 2/. put a question mark of state sector pensions and 3/. forced a reassessment of state pensions paid to retirees.

Blaming business

The general consensus at the time (i.e. 2002 – 2006) was that pensions run by private firms and pensions generally were unsustainable in the unfolding economic situation – but bear in mind this was 4 years before the world of banking collapsed of 2009. (Pensions are a complex issue and the lead up to the Turner Report cannot be adequately covered in this article).

But were the “fiscal burdens” mentioned above entirely home-made by workers and business, or the consequence of an immigration policy ?

It was Leo McKinstry who let Londoners know that in inner London, 55% of all births were to foreign-born mothers and that net inward migration into Britain was probably greater than that for Canada. In the same ‘Spectator’ article, 23rd April 2005, Leo McKinstry states:

  • “And the ethnic minorities are far more likely to be welfare recipients   than are their white counterparts; 28% of all ethnic minority groups and 34% of all blacks receive income-related benefits compared with 18% of whites.”

This is not new ‘news’ for the working class but in 2005 this verged on subversive sedition.  The difference is that someone ‘in authority’ has disclosed it and in so doing validated what had previously been dismissed and smeared as prejudice and ignorance. Although it might have reinforced those working class attitudes, the majority are unlikely to be Spectator readers.

Similarly, those that are disenfranchised most are unlikely to know that according to the Department for Work and Pensions (DWP), an astonishing 61% of Bangladeshis in Britain are either unemployed or economically inactive, compared with just 23% of the white population, while 45% of Africans are unemployed.

Overall, 41% of ethnic minorities are without jobs — hardly the dynamic contribution so often portrayed in state propaganda.

Some Labour MPs are on record as assaying, in 2005, that the current immigration system was a shambles and that “that there was a ‘culture of institutional chaos’ within the system.”  

  • “I find official indifference astonishing. What the immigration authorities are admitting is that they do not have a clue how many people are settling in this country.” – Roger Godsiff, MP (Birmingham Sparkbrook and Small Heath).

Jolted into action

The Closing of the British Mind was so total between 1999 – 2010 that the far-right Dutch politician Geert Wilders – an EU citizen with all the rights to travel within the EU – was first detained and then refused entry to the UK when he landed at Heathrow Airport (12th Feb 2009). Geert Wilders had been invited by the Freedom Party leader to show his film Fitna in the UK’s House of Lords.

Right: Geert Wilders MEP

Accused of ‘islamophobia’ he was forced to appeal at an Asylum and Immigration Tribunal which overturned the decision in Oct 2009 of the ban issued by the then Home Secretary, Jacqui Smith.

Perhaps she was aware that Wilders had increased his partY’S representation at every election since 1998.

In 2002, there were more than 111,000 asylum applications to Britain – more than double the number in France.
As a proportion of population, Home Office figures show the UK received 1.8 applications for every 1,000 residents. This was less than half the highest application rates seen in Sweden, Norway and Austria but as will be shown below, ‘ratios’ can be misleading

Holland

In an article for Aljazeera fellow Dutchman Anno Bunnikdescribed Geert Wilders’ rise to prominence in Dutch politics as “shocking” and included the phrase ‘sorcerer’s apprentice’ . [11] By innuendo Bunnik even tried to link Wilders with Anders Breivik who killed 77 young people in Norway – as if Islam does not have it own killers of children. [12] However, as Bunnik had to concede, this did not harm his political position with voters who were able to distinguish between a quote, “terrorist”, and a legitimate politician. This is a feature that seems to be lacking in the Arab / Muslim world – but then that could also be due to ignorance levels and the ‘herd’ mentality (ref. shooting dead of the American Ambassador in Libya, 2012).

The meteoric rise of the populist Pim Fortuyn – who campaigned on an anti-immigration, anti-Islam ticket – was widely interpreted as a wake-up call for Dutch politicians.

Right: Pim Fortuyn (assassinated 2002)

Pim Fortuyn was assassinated by, of all things, an “animal rights activist” (Volkert van der Graaf) on 6th  May 2002. [13]

Coming from a liberal tradition, and one of tolerance, Dutch politicians had studiously avoided questions of immigration and integration. But so unyielding have immigrants shown themselves to fit in to the host nation that Hans Wansing, a political commentator at the Dutch daily De Volkskrant believes “It’s probably fair to say that the Dutch have become less liberal.”

  • “A lot of people feel we have been too tolerant over the years – hence the appeal of Pim Fortuyn when he started breaking taboos.”

In Holland, as well as in Italy, civic tranquility has been shattered by Islamist and or immigrant unrest. [14] Tolerant Holland experienced a Dutch-Moroccan Muslim assassinating film maker Theodoor “Theo” van Gogh in broad day light, gunned down on Nov 2nd 2004 (Van Gogh was shot eight times with a semi-automatic pistol, he was then stabbed in the chest and an attempt to decapitate the body was made with a second knife).

Right: Theodoor “Theo” van Gogh (also assassinated on 2/11/2004)

Peculiarly, ‘far right parties’ are blanked both by the media and authorities yet they have every right (having fought two world wars) to exist as far left parties (which invariably get treated much more favourably).

Sweden

When the far-right and anti-immigration ‘Sweden Democrats’ party, lead by Jimmie Akesson, won 20 of the 349 seats in the country’s election it came despite being boycotted by media outlets for the customary political debates leading up to elections. [15]

If the world thinks Norway was shocked by the terror-shooting by Anders Breivik it is overlooking Norway’s  ethnic riots and Sweden’s spike in rapes by immigrants.

Sweden’s population of under 9 million in 2003  rose to 9½  million  (9,417,000)  in 2010 and the number of immigrants rose from 63,795 in 2003 to 99,000 in 2010 – a flea bite compared to the UK – and approx. half that number circa 43,000 emigrating in 2010. [16] Nearly one in five of the population has a foreign background and it is estimated that 15% of Sweden’s population is born abroad.

Norway

In Norway the comparable figure is only 1 in 8. Immigrants and those born in Norway to immigrant parents constitute 600,900 persons or 12.2% of  Norway’s total population (in Britain 1 in 12 of the population were born overseas).

Analysis of immigrants by geographical region reveals the composition to be: 287,000 who have a European background; 210 000 who have an Asian background; 74,000 from Africa; 19,000 from Latin-America and 11,000 from North America and Oceania.

Of all Norwegian-born persons with immigrant parents 54% had an Asian background.Having said that, Greece now accounts for 90% of all detected illegal immigration into the EU.

Denmark

The Danish People’s Party was founded on 6 Oct 1995 and is described as a far-right and anti-immigration party. In the 2007 parliamentary election the party took 25 seats in the 179-member Folketinget (i.e. 13.8% of the vote, and the third largest party in Denmark). Only about 4.8% of Denmark’s population of 5.5 million are refugees or immigrants, but the problem is their unemployment rate and non-integration, which casts them adrift as drones and welfare cheats in a tight, industrious society.

Austria

In 2000, Jörg Haider’s Austrian Freedom Party and the People’s Party were elected and formed a coalition government. The machinations are none too clear but the heads of government of the other fourteen EU members decided to cease cooperation with the Austrian government, even though it had been democratically elected !

For several months, national EU leaders shunned diplomatic contacts with members of the Schüssel government. 

Left: Jörg Haider (b.1950 – killed [?]2008)

Embarrassed by the pro-right policies, the left-leaning governments (Social Democrats and Christian Democrats) of the EU could not in all conscience be seen to be doing business with Austria – yet doing business with communist Soviet Russia was OK.

Haider and his party vigorously opposed immigration and sometimes made public statements seen as offensive to immigrant populations. In the early 1990s, Haider proclaimed – somewhat prophetically – that:

  • “The social order of Islam is opposed to our Western values. Human rights and democracy are as incompatible with the Muslim religious doctrine as is the equality of women. In Islam, the individual and his free will count for nothing; faith and religious struggle – jihad, the holy war – for everything.”

Apart from Turkey, which made deliberate strides after 1927 the was no Islamic country with a functioning democratic process during the entire 20th century. However, a Turkey  “Mk II” have emerged embracing Islam in government in a way Atatürk (1881 – 1938) would have deplored.

Australia

Once seen as something of a backwater it had so smooth an immigration policy that it never registered on the radar. However, all that has all changed in recent years. In the Aug 2010 General Election the nation made up its mind that immigrants were the most sensitive public issue.

In a country big enough to be categorised as a continent, Australia is trying to control the 6,300 asylum seekers that reached Australia in 130 boats in 2010 (thought to be highest number in 20 years), with the highest number coming from Afghanistan (2,700). [17]

By Aug 2011 the Australian government, representing the people, found itself locked in a battle with the courts, representing the law and humans rights, over its right to negotiate a swap of refugees with Malaysia. Under the deal, Australia would have sent 800 asylum seekers to Malaysia and would have received 4,000 refugees in return over four years.

Parallels with the Vietnamese Boat People of the late 1970s and early 1980s come flooding back of which Australia accepted 137,000 and who have not shown themselves to be disruptive to any of the many countries that took in the 1¼ million starving refugees.

The problems posed by immigration – legal and illegal – are felt from Australia, to Canada, the US to Scandinavia and mainland Europe too. (see Appendices for all the countries mentioned above).

It is not, therefore, a UK phenomenon but within the EU there is, rightly or wrongly, a pan-European reflex which is inextricably linked with Muslims and an aversion to their demands for censorship on our right to free speech. In the West we find intolerable because we value highly its effects in fostering the Arts the Sciences and Political Philosophy. This level of deliberate antagonism of the host nation is singularly not found among Hindus or Chinese or Buddhists.

Arguably, as a quid pro quo, if we are tolerant of their right to insult and abuse Europeans, Christians and, of course, Jews then they should be tolerant of other points of view if they want to stay and build their mosques in Europe.

Splendid isolation

The intelligentsia has long ago retreat to their ivory towers and make-believe world of harmonious multi-culturalism.

Intellectually abandoned and politically disavowed, the working class and low skilled have few champions. It takes people like Prof. Robert Rowthorn to articulate the problems. As an academic economist, he has examined many of the “serious studies” that have analysed the economic effects of immigration and which have come down in favour of it (see IPPR above).

Prof. Rowthorn says there is no evidence from any of them that large-scale immigration generates large-scale economic benefits for the existing population as a whole. On the contrary, all the research suggests that the benefits are either close to zero, or negative.[18]

  • “For low-skilled Britons, the result is that there are only two options: very low pay or unemployment. The economy becomes dependent on a constant influx of immigrants who are willing to accept low pay and poor working conditions. That is what Labour ministers mean when they insist that “public services would collapse without immigrants”.
  • It is bizarre that the Labour Party, which still continues to insist that it is the party of the poor and vulnerable, should endorse a policy the purpose of which is the creation of what Marx called “a reserve army of labour”: a pool of workers whose presence ensures that rates of pay for cleaners and ancillary staff in the NHS can be kept as low as possible.
  • Relative to population, the scale of immigration is now much greater than during any period since the Anglo-Saxon and Danish invasions over a thousand years ago.”

Leo McKinstry, writing in the Daily Telegraph (15th Nov 2006) articulates the situation well – the one ethnic group that it is perfectly acceptable to insult and ignore is the white working class. [19]

  • “Once regarded as the backbone of Britain, the people who saved our country in two world wars, the indigenous, less affluent, sector of the population is now treated with contempt by liberal elitists, who sneer at the supposed idleness, vulgarity, xenophobia and ignorance of so-called “chavs” or “white trash”.

Labour’s re-assessment

Ed Miliband, the Labour Party’s new leader has now admitted his party “got it wrong on immigration when in government. [20] Miliband’s shift on immigration policy has left Tony Blair and Gordon Brown quite exposed. His new position is that Gordon Brown and Tony Blair should not have allowed uncontrolled immigration from new EU states in 2004 conceding that as a Party:

  • “We became too disconnected from the concerns of working people.”

Two incidents encapsulated what many saw as the Labour government’s failure to “get” why so many people were worried about immigration. Firstly, in 2007 Gordon Brown promised “British jobs for British workers.” It was an impossible promise to keep, given the guaranteed free movement of people within the European Union.

Secondly, a campaigning Gordon Brown famously described a Labour supporter (and pensioner) from Rochdale as noting more than a “bigot” after she raised immigration with him during the general election.

The fact is, the Labour Party been too quick to accuse Conservatives, and others, of racism when in the past they have been silenced by the racist card whenever they have tried to talk about immigration in a measured and sensitive way. [21]

“The left” is traditionally uncomfortable talking about immigration. They like to see themselves as internationalist and righteously claim a long but unsubstantiated anti-racist tradition. The left has seen immigrants as prime voting fodder to keep them in power – a characteristics found in too many other countries.

Despite all the sometimes contradictory evidence the reality, so the BBC maintains, is that in the Labour years there was net foreign immigration of three and a half million (3½ million) – only one in five of those was actually from the European Union. Compared with 10 years ago net migration from the EU is 67,000, or 10 times higher than it used to be.

Neo-colonialism

American had its flirtation with the ‘new conservatives’ (Neo-Cons) during George W Bush’s administration which ended in disaster and Britain has had a secret 10-year-long love affair with immigration. According to some, politics now has a new twist up its sleeve, it is going to quietly colonise our minds with thoughts it approves of and thinks is in our best interests.

Brendan O’Neill the editor of “spiked”, a much respected and accurate on-line magazine, gave a speech a few months before the British 2010 general election. The subject was “Do they know what we’re thinking ? Changing attitudes to the electorate” and in summary he was of the view that it was becoming ever more clear that the political class views the electorate as an ‘incomprehensible, inscrutable blob.’ [22]

The main problem that we face today was not, as he saw it, that the political elite doesn’t know what we’re thinking – it’s that the political elite doesn’t care what we’re think.

  • “It is becoming increasingly clear that the political oligarchy which rules Britain looks upon the mass of the population as simply the targets of its various initiatives. It doesn’t look at us as rational political actors whose minds should be engaged; it looks at us as an incomprehensible, inscrutable blob whose behaviour must be managed. It is not interested in what we think; it is only deeply concerned about how we behave.”

Politicians are no longer ‘one of us’ but use us as a ‘means to an end.’ we are a virgin territory ripe for capture profiting from and then and taxing – a new Sparta with the public being the helots.

  • NB. Tied to the land, Helots worked in agriculture as a majority and economically supported the Spartan citizens. Their exact status is hotly disputed some historians say they were “slaves” while others say they occupied a status “between free men and slaves.”

According to the outspoken but clear-thinking left-winger Brendan O’Neill:

  • “We live under an elite which conceives of itself as an isolated bastion of liberalism, cosmopolitanism, tolerance and official anti-racism, and which conceives of everyone else as caricatured Daily Mail readers with base instincts and vulgar passions who must somehow be remade.”

Political parties have bought into the ‘social brain project’ – this is the lust to see all brains as infinitely malleable. The general public has no idea what is going on behind closed doors. The elite is not interested in what you think about the recession, or the economy, or capitalism – it is only concerned with controlling your inner Daily Mail demon. http://www.spiked-online.com/site/printable/8499/

With something as momentous as the recession what was the elite’s first reaction ? One of the first things the government did was publish a report called ‘Real Help Now for Women’ in which it promised to protect women from an expected rise in wife-beating. New Labour’s Baroness Scotland warned that ‘domestic violence will rise with increased financial worries’. Has it ? Concerns were also expressed that women would be disproportionately impacted more than men in being made unemployed.

The next thing government did was launch a campaign against what one government minister described as ‘credit crunch racism’. Government officials said that the ‘permanent and embittered underclass’ (their words) might take their anger out on ethnic minorities. Then the government announced that it would train an army of therapists to deal with what it labelled ‘the epidemic of anxiety’ that the recession would cause. Once again, has it ?

Controlling your ‘inner Daily Mail demons’ can be seen in virtually every political issue of today – from immigration to terrorism, from the recession to the workplace –  the political oligarchy doesn’t care what we actually think about any of those important issues, it is only concerned with regulating our passions in relation to them. By social engineering they manage our behaviour, by bestowing some of their ‘enlightened cosmopolitanism’ on us the moronic masses.

A classic is to compare attitudes towards homosexuals 20 years ago and their normalisation into the mainstream of cultural life today (a project that was launched in the mid 1970s). Ditto for the single unwed mother and the illegitimate child.

Who now dare raise their voice against them now that they have ‘minority’ status ?  Have we been cowed or do we honestly think our free speech does not legitimately extend that far ?

This is all deeply Orwellian. There’s a powerful element of Doublethink. Another speaker joining Brendan O’Neill on the panel used the term ‘libertarian paternalism’ to describe the power of nudge politics to steer people in the right direction – which brings to my mind the slogan ‘freedom is slavery’ from George Orwell’s book “Nineteen Eighty Four” (people are often systematically irrational so why care about them ? Care should only be directed at making them rational somehow, by reshaping their nature).

The fuss caused by the 2005 election posters (“Are you thinking what we’re thinking ?”), revealed how cluelessness were both the political class’s about what we think – but also the fear of what we think.

On the one hand we had the Tory Party arguably stoking up the fires of unrest while on the other we had the liberal elite’s fear of the masses which left them not wanting to know what we were thinking. The prospect was too terrifying for them and so not unnaturally they were angry with the Tories for asking the question in the first place.

Incomparably, this demonstrates that the political elite genuinely thinks of itself as a superior race – a superior race of liberals, if you like, with the rest of us as a mongrel race of reactionaries.

G.K. Chesterton

G. K. Chesterton is an exceptional author from the beginning of the 20th century. Known for his extravagant, satirical, amusing but often cutting remarks he has proved remarkably prophetic. In his 1914 novel “The Flying Inn” Chesterton predicts a future England dominated by Islam.  [23]

The book is about England altering her laws and culture to mollify Islamic tradition and practice; however, it is not about the Islamification of Europe although that does appear to be emerging in various guises.

The basis he utilises is the blanket blindness and utter intolerance of the US Temperance Movement – reminiscent of the 17th century’s Ranters, Diggers and Levellers – and later the Shakers.[24]

Political figures and manipulators recruit Islam to enforce their ideal which is the prohibition of all alcohol.These political figures think they are actually working to modernise the culture and their concepts of modernism involve the slow modernisation of mankind too. Lord Ivywood is that archetypal modernist who rejects the spiritual and cultural patriarchy of the Christian tradition in England but does not embrace Islam but uses it simply as a catalyst for his agenda.

The following exchange between Mr. Crooke and Lord Ivywood powerfully sums up the motivation for the modernisation and shows that Ivywood fascination with Islam is not about Islam itself but is about creating a new man:

  • Mr. Crooke: “Do you think you made the world, that you should make it over again so easily ?”
  • Lord Ivywood: “The world was made badly and I will make it over again.”

The terrorists, as the state perceives them to be, are a tiny underground group of two or three men who spread unrest by being armed only with a by now forbidden Inn sign, a large cheese, and a barrel of rum, who personify traditionalist virtues. They roam the country in their cart with a barrel of rum in an attempt to evade Prohibition, exploiting loopholes in the law. Eventually the heroes and their followers foil an attempted coup by an Islamic military force and this leads to a revolt against a perplexed Ivywood.

Conclusion

The government’s own immigration target was to get net migration down to the tens of thousands by the end of this Parliament. The new Home Secretary, Theresa May MP pledged at the Conservative Party conference to restore ‘sanity’ to immigration. [25] Prime Minister David Cameron had also promise reduced immigration:

  • ‘No ifs. No buts. That’s a promise we made to the British people.’

Labour’s Shadow Home Secretary Yvette Cooper MP was well within her rights to point out that the migration figures released in May 2012 showed a failure and a broken promise.[26]

However the situation would seem to be more intractable than anyone could have imagined – anyone that is outside the Home Office as Steve Moxon relays.

Devolving operations Home Office such a visa and immigration controls to smaller separate and outwardly independent bodies has not solved the inherent problems The truism of “garbage in – garbage out” would seem to apply outside the computer world and into the new bureaucracies that are now imported the same strain of Home Office virus.

Britain’s new Eurostar terminal is far younger than Heathrow yet between 2007 and 2011 500,000 people were allowed to enter via the purpose-built St Pancras station without being checked against a warning index. [27] This is in addition to Robert Brodie Clark’s decision in the summer of 2011 to waive all fingerprint checks at Heathrow airport (see Archaic machineryabove).

In very nearly every geographical location local Muslim are in dispute with local non-Muslims, be it Christians in Pakistan and Nigeria or Buddhists in Burma and Thailand (2009 – 2012), or the Philippines (since the 1980s).

Why should this be ? Is it the intolerance of locals or the intolerance of Muslims ?

The Rohingya are a Muslim ethnic minority found in Burma and Thailand and are having to flee from civil unrest house burning etc. to Bangladeshi refugee camps.

Is there something of a ‘victim culture’ lurking deep within Islam yet co-existing with a rampant resurgence and a divine right to overwhelm all ‘infidels’ ? A curious reblending has emerged where infidel which once meant someone who did not believe in any one single God, has today been replaced by anyone not believing in the prophet Mohammed.

Above:  In Rome mobs of Muslims roam the streets [allegedly] hunting for Peruvians and Ecuadorians.[28]

Some of us can recall a more peaceful coexistence with Islam of 50 or 40 years ago. Indeed, Islam has contributed to medical science and the humanities for over 1,000 years.

In that context the past 20 years should perhaps seen as an aberration which will hopefully correct itself – perhaps when the majority of Muslims, who want a quiet life and to enjoy their families just like everyone else, put a strangle hold on their own radical groups. Then they will be seen as joining in and being part of the host society.

If it is any comfort James Bissett, a former head of the Canadian Immigration Service, has suggested that the lack of any credible refugee screening process, combined with a high likelihood of ignoring any deportation orders, has resulted in tens of thousands of outstanding warrants for the arrest of rejected refugee claimants. This is the same best practice Canadian system that the defenders of the London Metropolitan University were citing.

According to James Bissett, there is  little attempt at enforcement and a 2008 report by the Auditor General, Sheila Fraser, stated that Canada has lost track of as many as 41,000 illegal immigrants.

It is therefore fitting that governments should currently see the emergence of groups like the English Defence League not as an expression of the voter  but as hostile and a threat to public , ie it’s own, stability. Though the rationale has long since past, old bureaucratic habits are hard to unmake. The plot of Chesterton’s novel and the adventures of the ‘terrorist’ heroes (e.g. the EDL), forced to roam the country having flash demonstrations simply to exercise their democratic rights fit uncomfortably into the contemporary scene.

That the political landscape has permanently changed is beyond doubt but what will happen next is open to speculation.

E N D

Appendix A

Estimated overseas-born population resident in the United Kingdom, by country of birth – Oct 2010 to Sept 2011

Appendix B

USAPersons Obtaining Legal Permanent Resident Status: Fiscal Years to 2011


Appendix C
 

[2] National Institute of Economic and Social Research, http://www.niesr.ac.uk/pdf/090112_163827.pdf

[3] See also http://www.ippr.org/articles/56/8491/does-immigration-cause-unemployment Overall, around 400,000 students come to British colleges and universities each year and make up the major component of the UK’s £15bn-a-year education exports

[7] “Minority Births Are New Majority”, May 17th 2012, Wall St Journal

http://online.wsj.com/article/SB10001424052702303879604577408363003351818.html

[8] In 1996 TANF replaced “Aid to Families with Dependent Children” (AFDC).

[10] Science Oxford, 24 October 2007 UK population in the 21st Century, D.A. Coleman University of Oxford david.coleman@socres.ox.ac.uk   and   http://www.apsoc.ox.ac.uk/oxpop 

[11] Anno Bunnik is a political analyst from the Netherlands. http://www.aljazeera.com/indepth/opinion/2012/09/201291192756398991.html

[13] Living the legacy of Pim Fortuyn, BBC 17 Feb 2004, http://news.bbc.co.uk/1/hi/world/europe/3496961.stm   

[14] Italian riots (Milan) have involved Muslims fighting with South American immigrants.

[18] “Never have we seen immigration on this scale: we just can’t cope” by Robert Rowthorn, 02 Jul 2006, http://www.telegraph.co.uk/comment/personal-view/3626107/Never-have-we-seen-immigration-on-this-scale-we-just-cant-cope.html 

[19] ‘In defence of the white working class’ http://www.telegraph.co.uk/comment/personal-view/3634265/In-defence-of-the-white-working-class.html

[21]  Miliband shifts immigration policy, saying Labour ‘got it wrong’ http://www.bbc.co.uk/news/uk-politics-18539472

[22] “Now the elite wants to colonise our brains”, – Brendan O’Neill, Tues 6 April 2010, http://www.spiked-online.com/site/printable/8499/

[23] G. K. Chesterton http://en.wikipedia.org/wiki/The_Flying_Inn The first of Chesterton’s novels was The Napoleon of Notting Hill (1904), which begins in a London of 1984 is the date merely coincidental ?

[25] Tuesday 04 October 2011